Removal of Congo Red and Acid Yellow 36 Dye Using Orange Peel and Rice Husk as Absorbent
Y. C. Wong1*, K. N. Ranjini1 and W. A.Wan-Nurdiyana1
1Faculty of Agro Based Industry, University Malaysia Kelantan, Jeli Campus, Locked Bag 100, 17600 Jeli, Kelantan, Malaysia.
DOI : http://dx.doi.org/10.13005/ojc/300217
Article Received on :
Article Accepted on :
Article Published : 06 Jun 2014
Many researchers have identified the capability of agricultural wastes as absorbents to remove different types of pollutants including dyes. This study represents the use of orange peel (OP) and rice husk (RH) to remove two types of dye, Congo Red (CR) and Acid Yellow 36 (AY 36) dye and provides simple comparison between granular form of OP and RH and activated form of OP and RH. Both types of dyes are toxic and can cause severe problems to the environment. Factor such as absorbent dosage was studied. Batch absorption studies were conducted at 27˚C with constant stirring at 150 rpm for 2 hours and absorbent dosage of 0.2 to 1.0 g. The results showed that the activated form of OP and RH had the highest removal percentage of CR and AY 36 dyeswhich were up to 100% removal. This study indicates that OP and RH could be employed as low cost materials for the removal of textile dyes from effluents.
KEYWORDS:dye removal;congo red; acid yellow 36; absorbent; orange peel; rice husk.
Download this article as:| Copy the following to cite this article: Wong Y. C, Ranjini K. N, Nurdiyana W. A. W. Removal of Congo Red and Acid Yellow 36 Dye Using Orange Peel and Rice Husk as Absorbent. Orient J Chem 2014;30(2). |
| Copy the following to cite this URL: Wong Y. C, Ranjini K. N, Nurdiyana W. A. W. Removal of Congo Red and Acid Yellow 36 Dye Using Orange Peel and Rice Husk as Absorbent. Orient J Chem 2014;30(2). Available from: http://www.orientjchem.org/?p=3663 |
Introduction
Concerns for environmental crisis began during second half of 20th century due to various factors and undesirable experiences. The past mistakes from over-utilization of natural resources and harnessing the forces of nature for the benefit of growing human population and the concurrent apathy to environmental regeneration and conservation have begun to boomerang on the unsuspecting world population. Evidence of these phenomena can be seen in the spread of desertification floods, soil maladies, draughts, urban congestion, extinction of/or threat to countless species of plants and animals that made the eco-system an unchecked pollution of land, water and air (Ghosh, 2008).
The Department of Environment (DOE), Malaysia has been continuously monitoring river water quality to classify the pollution level and detect changes in the local rivers water quality. The Water Quality Index (WQI) is used as a basis for assessment of watercourse in relation to pollution load categorization and designation of classes of beneficial uses as stipulated in the National Water Quality Standards for Malaysia (NWQS). According to river water quality status in 2011, out of 464 rivers monitored, a total of 275 (59.3%) were found to be clean, 150 (32.3%) slightly polluted and 39 (8.4%) polluted. As in previous years, the major pollutants detected were Biochemical Oxygen Demand (BOD), Ammoniacal Nitrogen (NH3-N) and Suspended Solids (SS). High BOD can be attributed to untreated or partially treated sewage and discharges from agro-based industries and manufacturing industries (Zulkifli,Choong& Noor, 2011).
Dye is the molecule that produces color on fabric. The color in wastewater is the dye that is not fixed in the dyeing of fibre, yarn, fabric or garments being processed. The degree to which colorin the wastewater may be a problem, depending on the type or class of dye being used and the degree to which the textile effluent contributes to the flow of the receiving body (Hardin, 2007).
Environmental pollution by discharge of dye-containing effluents represents a serious ecological concern in many countries. Public demands for color-free discharges to receiving waters have made decoloration of a variety of industrial wastewater a top priority. The current existing techniques for dye removal have several drawbacks such as high cost, low efficiency, use of large amounts of chemicals and formation of toxic sub-products (Rodriguez, 2009). It is reported that 90% of the organic chemicals and auxiliaries in pre-treatment and dyeing operation do not stay on the fibre, whereas the reverse is true on the finishing treatment (Christie, 2007).
The decolorization and usage of reactive dyes of textile industry wastewater is a worldwide problem. Regulatory agencies are interested in new, efficient and improvised decolorization techniques. Bioremediation of textile effluent is seen as a good solution due to its low-cost, sustainable and acceptable technology. Besides that, there are many other methods in treating textile wastewater; sorption, oxidation reaction, membrane filtration and et cetera(Pereira &Madalena, 2012).
Absorption is the process by which one substance(gas, liquid or solid) is taken into the body of another substancewhere the molecules or ions penetrate into the interior of another substance. It is also known as the process in which one material (the absorbent) takes up and retains another (the absorbate) with the formation of homogeneous mixture having the attributes of a solution (Lee, 2005).
According to U.S. Department of Energy (DOE), biomass is any organic matter available on renewable basis, including crops, trees, agricultural crop wastes and residues, and other waste materials. Rice husk (RH) is a major by-product of rice farming. Environmental regulation limits disposal of the husk in landfills (Ravindra, Moray & Thomas, 2003). With this available large source of rice husk and easily obtainable agricultural waste, orange peel (OP) is convenient to be used in this thesis as the adsorbent in removing Congo Red and Acid Yellow 36 dye.Primary colors are pure or fundamental colors that cannot be achieved from a mixture. Red, yellow and blue colors form the primary triad (Alpert et al., 2004). Secondary color is color obtained by mixing equal parts of two primary colors. Green, orange and violet are secondary colors(Hornung, 2004). Both Congo Red and Acid Yellow 36 are among the prime colors in which other colors are made from. The purpose of conducting a study on the removal of these two prime colors is to ensure that the other colors made from these prime colors can be removed too by using the same method.
The objectives of the research areto determine the effectiveness of RH and OP in removal of Congo Red and Acid Yellow 36 dye from textile wastewater, to investigate the potential of RH and OP pretreated into activated carbon as dye removal and to optimize the removal of dye by varying the size of absorbent, OP and RH pretreated with acid into active carbon, agitation time and initial concentration.
Experimental
Experimental variables to be considered were:
- sizes of absorbents (>150µm, >425µm);
- acid treated and non-treated absorbents;
- agitation time (30, 60, 90, 120 min); and
- different initial concentrations (20, 40, 60, 80, 100) mg/L.
Preparation of Activated Carbon
The raw materials used for activated carbon (AC) preparation wereOP and RH. To produce the AC, dewatered OP and RH were mixed with concentrated H2SO4 (17.5M) and dried in air at room temperature for 24hours. 300g of the dried materials were put in an oven and heated at 180ºC for 24hours. The samples were then allowed to cool at room temperature in an inert atmosphere. The product resulted from the activation step was blended in order to form granular AC and washed with 3M NaOH. The carbon product was then vacuum-filtered through filter paper and washed repeatedly with distilled water to remove all traces of acid and alkaline until pH of rinsed water was constant. The product was thenwet-screed and dried at 80ºC for 24hours. Figure 1 showed the simplified chart of the methods used.
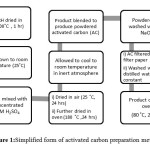 |
Figure1:Simplified form of activated carbon preparation method Click here to View Figure |
Dye Solution Preparation
For the preparation of aqueous solution, a stock of CR (1000mg/l) and AY 36 (1000mg/l) dyes were prepared and diluted to the required initial concentration.
Absorption Tests
The study employed the absorption tests of CR and AY36 dyes on OP and RH absorbents under different experimental conditions; (i) sizes of absorbents (>150µm, >425µm); (ii) treated and non-treated absorbents (iii) agitation time (30, 60, 90, 120 min) and (iv) different initial concentrations (20, 40, 60, 80, 100 mg/L).
For absorption analysis, a duplicate samples and control were prepared for further treatment analysis. The initial and final concentrations of CR and AY36 were obtained by measuring them with UV-spectrophotometer at 545 nm.
Separation Techniques
For separation between absorbent and solution, the samples were centrifuged at 1,000 rpm for 15 minutes. After centrifugation, the samples were removed and the supernatants were measured using UV-spectrophotometer. The final concentration was measured using UV- spectrophotometer to determine the colorthat has been removed from the solution. The process was summarized as shown in Figure 2.
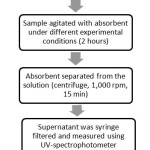 |
Figure 2: Separation technique chart Click here to View Figure |
Data Analysis
The data wereanalyzed by calculating the percentage removal of dye and the amount absorbed (in mg/g) using the following equation
Percentage removal = 100 (Ci – Cf ) / Ci (equation 1)
Ci and Cf are initial and final concentration (in mg/L) of dye respectively. Blank containing no dye was used for each series of experiments as control. The average values of 3 duplicates were obtained and analyzed.
Statistical analysis
All data in this study were subjected to analysis of variance procedure (One-Way ANOVA). The one way analysis of variance (ANOVA) is an inferential statistical test that checks if any of several means are different from each other. It assumes that the dependent variable has an interval or ratio scale, but it is often also used withordinally scaled data. The datawereanalyzed using Statistical Package for the Social Science (SPSS) software. Even though there were many parameters to be tested in this study, the results were proved to be significant or not separately. This was because the parameters were not related to one another.
Results and Discussion
Effect of absorbent dosage on the percentage of dye removal for different size of orange peel and rice husk in Congo Red and Acid Yellow 36 dyes
Figure 3 showed the effect of absorbent dosage against percentage of dye removal of Congo Red (CR) on different sizes of orange peel; i) raw orange peel <425µm (OP150), ii) raw orange peel >425µm (OP425) and different sizes of rice husk; i) raw rice husk <425µm (RH150), ii) raw rice husk >425µm (RH 425). A series of absorption experiment was carried out with different absorbent dosages (0.2, 0.4, 0.6, 0.8, 1.0 g) at fixed concentration of 60mg/L at constant volume of dye solution (50 mL) with constant rotation speed at 150rpm for 2hours. Similarly, the temperature was kept constant at 27°C.
From Figure 3, it can be seen that the highest percentage of removal of dye by OP 150 and OP 425 was shown at absorbent dosage 1.0 g in CR dye. Dye removal percentage of OP 150 was 95.49 % and OP 425’s was 88.66 %. The lowest percentage of dye removal by both OP 150 and OP 425 were at 0.2 g absorbent dosages which were 77.19 % and 72.18 % respectively. The CR dye was absorbed more effectively by the smaller size of orange peel (OP 150).
 |
Figure 3: Effect of absorbent dosage on the percentage of dye removal for OP 150, OP 425, RH 150 and RH 425 in CR Click here to View Figure |
Meanwhile the RH samples also showed that the highest percentage of dye removalby RH 150 and RH 425 were at 1.0 g absorbent dosage in CR dye. RH 150 percentage of dye removal was 88.33% while RH 425 was 81.67%. The lowest percentage of dye removal by both RH 150 and RH 425 was at absorbent dosage 0.2 gwhich was 48.33 %. The CR dye was found to be absorbed more effectively by smaller size of rice husk (RH 150). The percentage of CR dye removal was highest when OP was used as absorbent.
Meanwhile Figure 4 showed the effect of absorbent dosage against percentage of dye removal of Acid Yellow 36 (AY 36) on different sizes of orange peel; i) raw orange peel <425µm (OP150), ii) raw orange peel >425µm (OP425) and different sizes of rice husk; i) raw rice husk <425µm (RH150), ii) raw rice husk >425µm (RH 425). A series of absorption experiment was carried out with different absorbent dosages (0.2, 0.4, 0.6, 0.8, 1.0 g) at fixed concentration of 60mg/L at constant volume of dye solution (50 mL) with constant speed of rotation 150rpm for 2hours. Similarly, the temperature was kept constant at 27°C.
From Figure 4, it can be seen that the highest percentage of dye removal by OP 150 and OP 425 was at absorbent dosage 1.0 g in AY 36 dye. OP 150 showed 88.33% dye removal and OP 425 dye removal was 81.67 %. The lowest percentage of dye removal for both OP 150 and OP 425 was at absorbent dosage 0.2 g which was 48.33 %. AY 36dye was absorbed more effectively by the smaller size orange peel (OP 150).
While the RH samples showed that the highest percentage of dye removal of RH 150 and RH 425 was at dosage absorbent 0.8 g in AY 36 dye. The dye removal percentage for RH 150 was 32.1% while RH 425 was at 31.8%. The lowest percentages of dye removal by both RH 150 and RH 425 were at absorbent dosage 0.2 g which were 27.16 % and 22.22% respectively. AY 36dye was absorbed more effectively by smaller size rice husk (RH 150). The dye removal percentage of AY 36 is highest when OP was used as absorbent.
Both Figure 3 and Figure 4 showed that smaller size of both OP and RH had higher absorption rate compared to the larger sizes. The smaller the size of the absorbent, the greater its surface area in which it provides more binding sites for the dye molecules. Besides that, absorbent with smaller size contacts with sorbate faster at the binding site (Asgher&Bhatti, 2012).
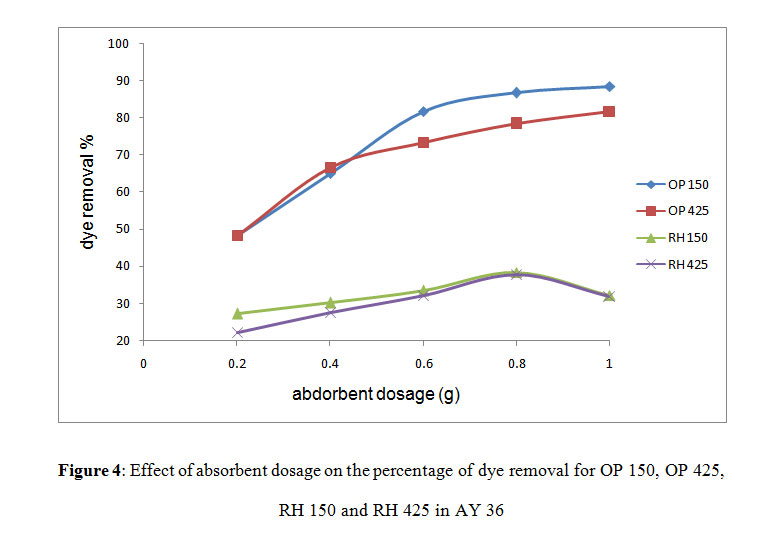 |
Figure 4: Effect of absorbent dosage on the percentage of dye removal for OP 150, OP 425, RH 150 and RH 425 in AY 36: Click here to View Figure |
It was also shown that the dye removal rate increases with increasing absorbent dosage. This was due to the increased number of absorbent whichalso increasedthe surface area for dye bindings. This was in agreement with the findings of Khaled et al. (2009). Usage of OP as absorbent gave the highest percentage of dye removal in both CR and AY 36.
OP principally consists of cellulose, pectin, hemicellulose, lignin, chlorophyll pigments and other low molecular weight hydro-carbons (Lianget al.,2010). These components contain various functional groups, such as carboxyl and hydroxyl groups which turned itinto potential absorbent material for removing metal ions from aqueous solutions (Arami et al.,2005).
Since OP is composed of various functional groups, it could also be affected by the pH of the solutions. Therefore, electrostatic attraction, as well as organic properties and structure of dye molecules and OP could play an important role on dye adsorption on OP. Dried OP with pH 4 has higher tendency of electrostatic attraction compared to RH with pH of 5.5. This is because both dyes have an anionic functional group.
At pH 4, a high electrostatic attraction exists between the positively charged surface of the absorbent and the anionic dye. Since the pH of RH is 5.5, the electrostatic attraction is lower compared to OP. This indicates the reason why the percentage of dye removal was higher for OP compared to RH. As the pH increases, the number of positively charged surface site on the absorbent decreases.
Effect of absorbent dosage on the percentage of dye removal for acid-treated form of orange peel and rice husk in Congo Red and Acid Yellow 36 dyes
Figure 5 showed the effect of absorbent dosage against percentage of dye removal of CR on acid activated orange peel (AC OP) and acid activated rice husk (AC RH). A series of absorption experiments was carried out with different absorbent dosages (0.05, 0.1, 0.15, 0.2, 0.25, 0.3 g) at fixed concentration of 60 mg/L at constant volume of dye at 50 mL with constant speed of rotation 150 rpm for 2 hours. The temperature was kept constant at 27˚C.
From Figure 5 it can be seen that the highest percentage of dye removal by AC OP was at absorbent dosage 0.25 g in CR dye, up to 100 %. The lowest percentage of dye removal by AC OP was at 0.05 g which was 19.27 %. It can be said that AC OP absorbs CR dye effectively compared to OP 150 and OP 425. However the best removal was obtained using AC RH as the absorbent. The removal was 100 % at 0.05 g of AC RH itself. This showed that AC RH removes dye efficiently even at lower dosage of absorbent.
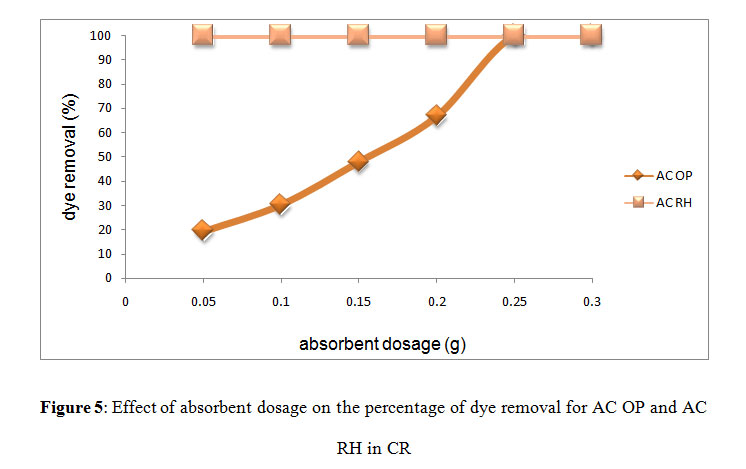 |
Figure 5: Effect of absorbent dosage on the percentage of dye removal for AC OP and AC RH in CR Click here to View Figure |
Figure 6 showed the effect of absorbent dosage against percentage of dye removal of AY 36 dye on acid activated orange peel (AC OP) and acid activated rice husk (AC RH). A series of absorption experiments was carried out with different absorbent dosages (0.05, 0.1, 0.15, 0.2, 0.25, 0.3 g) at fixed concentration of 60 mg/L at constant volume of dye at 50 mL with constant speed rotation 150 rpm for 2 hours. The temperature was kept constant at 27˚C.
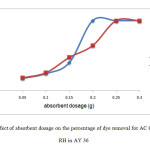 |
Figure 6: Effect of absorbent dosage on the percentage of dye removal for AC OP and AC RH in AY 36 Click here to View Figure |
Figure 6 showed the highest percentage of AY 36 dye removalby AC OP was at dosage 0.2 g. The removal was 100 %. The lowest removal percentage was at absorbent dosage of 0.05, which only removed 17.5 % of the dye. The usage of AC OP as absorbent had to be terminated as the AC OP released a dark color when agitated with the dye. This went against the objective of this study, which was to ensure the environmental safety due to the usage of textile dye.
The reasons behind the great absorption capacity of AC OP and RH were due to the microporous and high surface area of the activated product. The absorption of bigger size compounds such as dyes, dextrines or natural organic materials requires a material with high mesopore contribution to the total pore volume of absorbent (Lorenc-Grabowska&Gryglewicz, 2006).
Pretreatment of RH can remove lignin, hemicellulose, reduce cellulose crystallinity and increase the porosity or surface area. In general, chemically modified or treated RH exhibits higher absorption capacities compared to unmodified RH.
Effect of initial concentration on the percentage of Congo Red and Acid Yellow 36 dye removal for orange peel and rice husk <425µm and >425µm
Figure 7 showed the effect of initial concentration against percentage of dye removal of CR on OP 150, OP 425, RH 150 and RH 425. A series of absorption experiments was carried out with different initial concentration of CR (20, 40, 60, 80 and 100 mg/L) at fixed volume of dye solution (50 mL) with constant rotation speed 150rpm for 2hours using absorbent dosage of 1.0 g. The temperature was kept constant at 27˚C.
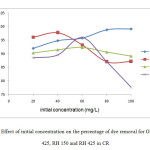 |
Figure 7: Effect of initial concentration on the percentage of dye removal for OP 150, OP 425, RH 150 and RH 425 in CRClick here to View Figure |
Figure 8 showed the effect of initial concentration against percentage of dye removal of AY 36 on OP 150, OP 425, RH 150 and RH 425. A series of absorption experiments was carried out with different initial concentration of CR (20, 40, 60, 80 and 100 mg/L) at fixed volume of dye solution (50 mL) with constant rotation speed 150rpm for 2hours using absorbent dosage of 0.8 g for RH and 1.0 for OP. The temperature was kept constant at 27˚C.
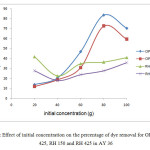 |
Figure 8:Effect of initial concentration on the percentage of dye removal for OP 150, OP 425, RH 150 and RH 425 in AY 36 Click here to View Figure |
Figure 7 and Figure 8 showed that the initial concentration of the dye did influence the dye removal rate. In most cases for CR, the lower the concentration of the dye, the higher the dye removal percentage. This might be because of the low initial concentration of the dye which also meant that the particles of dye were also lower and the absorbent surface area was completely available for dye bindings without much competition.
The dye removal percentage was 96.11 % for OP 425 on CR dye at initial concentration of 20 mg/L whereas the removal decreased to 87.13 % when the initial concentration was changed to 100 mg/L. This might be because of the concentrated binding site did not allow complete removal of dye at higher initial dye concentration.
Meanwhilefor AY 36 dye removal using OP and RH as absorbents, the initial concentration with highest percentage of dye removal was at 80 mg/L for both OP 150 and OP 425. While the highest dye removal percentage for RH 150 was at dye initial concentration of 20mg/L at 41.66 %.
The results showed that the amount of dye absorbed was different depending on the products and dyes. It showed different optimum removal of each product on the dye. For example, as per OP 150 on CR, the optimum removal was up to 100 mg/L while the optimum removal by OP 425 on CR was at 40 mg/L.
After the optimum stage for removal was achieved, the increase in initial concentration resulted in lower dye removal percentage. This was because the surface area of the product became saturated for the binding of the dye molecules (Khaled et al., 2009).
Effect of agitation time on the percentage of Congo Red and Acid Yellow 36 dye removal for orange peel and rice husk <425 µm
Figure 9 showed the effect of agitation time on percentage of removal of CR on OP<425 µm (OP 150) and RH <425 µm (RH 150). A series of absorption experiment was carried out with different agitation times (30, 60, 90, 120 min) at absorbent dosage of 1.0 g, initial concentration of 60 mg/L without changing the volume of dye solution (50 mL) with constant speed of 150 rpm. Temperature was kept constant at 27˚C.
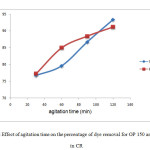 |
Figure 9: Effect of agitation time on the percentage of dye removal for OP 150 and RH 150 in CRClick here to View Figure |
The results showed that the longer the agitation time, the higher the rate of dye removal. At minute 30, the removal of CR bye OP 150 was 76.73 % while the removal of CR by RH 150 was 77.27 %. The removal percentage increased to 93.37 % using OP 150 and 91.18% using 150 when the agitation time was increased to 120 minutes (2 hours).
Same goes to the removal rate for AY36. The longer the agitation time, the higher the percentage of dye removal.Based from Figure 10, the percentage of removal by OP 150 at 30 minute was 17.81%. It increased to 46.76% after agitated for 120minutes. Meanwhile the percentage of removal by RH 150 on AY 36 was 15.67% at 30 minutes, and increased up to 32.89% after agitated for 120 minutes.
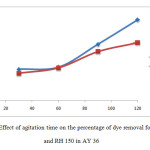 |
Figure 10: Effect of agitation time on the percentage of dye removal for OP 150and RH 150 in AY 36 Click here to View Figure |
This was due to the exposure of dye particles to the binding site of OP and RH. The longer the particles were exposed to the binding site of the absorbents, the higher the percentage of dye removal. In the process of dye color absorption, the dye molecules have to first encounter the binding site and then diffuse to it. This phenomenon will take relatively long contact time (Malik, 2003).
Statistical analysis
T-test was performed under the confidence level of 99%. The result is significant if the significance level is less than 0.01. Based from Table 1, most of the results obtained achieved significance level less than 0.01 which indicated that the OP and RH were significant products for the removal of dye. The significance level was not up to the standard in the case of initial concentration manipulation of OP 150 and OP 425 on AY 36. Other than that, the agitation time of OP 150 on AY 36 also resulted in insignificant value of the t-test.
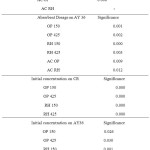 |
Table 1:T-test significant result Click here to View table |
Conclusion
OP and RH are cheap and easily available agricultural by-products which can be used effectively in removing dye. The present investigation has shown that the granular form and acid pre-treated OP and RH can be effectively used as raw materials for the removal of Congo Red and Acid Yellow 36 dyes from aqueous solution. The results showed that acid-pretreated OP and RH have the highest dye removal percentage which was up to 100 %.
The study also showed that both CR and AY 36 were removed by absorbent with lower pH levels. This was because CR and AY 36 were both anionic dyes, they reacted accordingly with their positively charged surface of the absorbent. Higher percentage of dye removal was also observed in smaller size absorbents compared to larger size absorbents. This was due to the larger surface area for the binding of dye molecules on the absorbents.
During the study, problem aroused when the pretreated OP gave out a very dark color due to the acid treatment. This can be overcome with the usage of bleach before OP treatment and continuous washing with distilled water until the color fades off.
Acknowledgement
The authors are grateful to the Faculty of Agro Based Industry, Universiti Malaysia Kelantan, Jeli Campus for providing the financial support for the present study.
Conflict of Interests
The Authors declare that there is no conflict of interests regarding the publication of this article.
References
- Alpert, A., Staff of Milady Publishing Company, Bru, Barnes, L., Barnes, L., Altenburg, M. (2004). Milady’s Standard Cosmetology. Delmar Thomson Learning.
- Arami, M., Limaee, N. Y., Mahmoodi, N. M. &Tabrizi, N. S. (2005). Removal of dyes from colored textile wastewater by orange peel adsorbent: Equilibrium and kinetic studies. Journal of Colloid and Interface Science, 288(2), 371-376.
- Asgher, M., &Bhatti,N. H. (2012).Evaluation of thermodynamics and effect ofchemical treatments on sorption potential of citrus wastebiomass for removal of anionic dyes from aqueous solutions. Ecological Engineering, 38(1), 79-85.
- Christie, R.M. (2007). Environmental Aspects of Textile Dyeing: EU Legislationon Chemical Substance. Woodhead Publishing.
- Department of the Environment (DOE).(1996). Textile Works and Dye Works. London: Department of the Environment.
- Ghosh, G. K. (2008). Environmental Pollution. APH Publishing Corporation.
- Hardin, I. R. (2007).Environmental Aspects of Textile Dyeing: ChemicalTreatment of Textile Dye Effluent. Woodhead Publishing.
- Hornung, D. (2004). Colour: A Workshop for Artists and Designers. UK: Laurenc. King Publishing.
- Khaled, A., Nemr, A. E., El-Sikaily, A., &Abdelwahab, Ola.(2009). Treatment of artificial textile dye effluent containing Direct Yellow 12 by orange peel carbon.Desalination, 238, 210-232.
- Lee, C. C. (2005). Environmental Engineering Dictionary (4th Ed.).USA: Government Institutes.
- Liang, S.,Guo, X., Feng, N., &Tian, Q. (2010). Isotherms, kinetics and thermodynamic studies ofadsorption of Cu2+ from aqueous solution by Mg2+/K+ type of orange peel adsorbents. Journal of Hazardous Materials,174, 756-762.
- Lorenc-Grabowska, E., &Gryglewicz, G. (2007). Adsorption characteristic of CongoRed on coal-based mesoporous activated carbon. Dyes and Pigments, 74(1), 34-40.
- Malik, P. K. (2003). Use of activated carbons prepared from sawdust and rice-husk for adsorption of acid dyes: a case study of Acid Yellow 36. Dyes and Pigment, 56(3), 239-249.
- Pereira, L., & Madalena, A. (2012). Environmental Protection Strategies for Sustainable Development: Dyes-environmental Impact and Remediation. Netherlands: Springer Netherlands.
- Ravindra, K. D., Moray, D. N., & Thomas, D.D. (2003). Sustainable Waste Management: Ecological Balance of Silicon Using Rice Hull Ash in Agriculture. The University of Michigan: Thomas Telford.
- Rodriguez-Couto,S. (2009).Enzymatic biotransformation of synthetic dyes. Current Drug Metabolism, 10(9), 1048-1054.
- Zulkifli, A. R., Choong, M. C., & Noor, S. A. (2011). Malaysia Environmental Quality Report. Department of Environment Malaysia.

This work is licensed under a Creative Commons Attribution 4.0 International License.
![]()
A New Edition of Web of Science
Journal Impact Factor
2022: 0.5
Five Year: 0.8
Journal is Indexed in

Cabells Whitelist
![]()


