Prediction of Drug Lipophilicity Using Back Propagation Artificial Neural Network Modeling
Saadi Saaidpour*
Department of Chemistry, Faculty of science, Islamic Azad University, Sanandaj Branch, Sanandaj, Iran
DOI : http://dx.doi.org/10.13005/ojc/300253
Article Received on :
Article Accepted on :
Article Published : 31 May 2014
A quantitative structure–property relationship (QSPR) study was performed to develop models those relate the structures of 150 drug organic compounds to their n-octanol–water partition coefficients (logPo/w). Molecular descriptors derived solely from 3D structures of the molecular drugs. A genetic algorithm was also applied as a variable selection tools in QSPR analysis. The models were constructed based on 110 training compounds, and predictive ability was tested on 40 compounds reserved for that purpose. Application of the developed models to a testing set of 40 drug organic compounds demonstrates that the new models are reliable with good predictive accuracy and simple formulation. Modeling of logarithm of logPo/w of these compounds as a function of the theoretically derived descriptors was established by artificial neural network (ANN). The neural network employed here is a connected back-propagation model with a 4-4-1 architecture. Four descriptors for these compounds molecular volume (MV) (Geometrical), hydrophilic-lipophilic balance (HLB) (Constitutional), hydrogen bond forming ability (HB) (Electronic) and polar surface area (PSA) (Electrostatic) are taken as inputs for the models. The use of descriptors calculated only from molecular structure eliminates the need for experimental determination of properties for use in the correlation and allows for the estimation of logPo/w for molecules not yet synthesized. The prediction results are in good agreement with the experimental value. The root mean square error of prediction (RMSEP) and square correlation coefficient (R2) for ANN model were 0.1838, 0.9876 for the prediction set logPo/w, respectively.
KEYWORDS:n-Octanol–water partition coefficients; Quantitative structure–property relationship; Genetic algorithm; Artificial neural network; Prediction
Download this article as:| Copy the following to cite this article: Saaidpour S. Prediction of Drug Lipophilicity Using Back Propagation Artificial Neural Network Modeling. Orient J Chem 2014;30(2). |
| Copy the following to cite this URL: Saaidpour S. Prediction of Drug Lipophilicity Using Back Propagation Artificial Neural Network Modeling. Orient J Chem 2014;30(2). Available from: http://www.orientjchem.org/?p=3488 |
Introduction
The n-octanol/water partition coefficient is the ratio of the concentration of a chemical in n-octanol to that in water in a two-phase system at equilibrium. The logarithm of this coefficient, logPo/w, has been shown to be one of the key parameters in quantitative structure-activity/property relationship (QSAR/QSPR) studies. The octanol-water partition coefficient is a measure of the hydrophobicity and hydrophilicity of a substance. Hydrophobic interactions are of critical importance in many areas of chemistry, including enzyme-ligand interactions, drug-receptor interactions, transport of drug to the active site, the assembly of lipids in bio-membranes, aggregation of surfactants, coagulation, and detergency, etc [1, 2]. Hydrophobic “bonding” is actually not bond formation at all, but rather the tendency of hydrophobic molecules or hydrophobic parts of molecules to avoid water because they are not readily accommodated in the highly ordered hydrogen bonded structure of water [3]. Hydrophobic interaction is favored thermodynamically because of increased entropy of the water molecules that accompanies the association of non-polar molecules, which squeeze out water. The hydrophobic “bonding” resulting from an unwelcome reception of non-polar molecules in water involves vander Waals forces, hydrogen bonding of water molecules in 3D structure, and other interactions [4].
Hydrophobicity affects drug absorption, bioavailability, hydrophobic drug-receptor interactions, metabolism of molecules, as well as their toxicity. Hydrophobicities of solutes are readily determined by measuring partition coefficients (logPo/w) using the shake-flask method (which involves distribution of a compound between an aqueous phase and an organic phase) and reversed phase high performance liquid chromatography [5, 6]. Since the experimental determination of the partition coefficient of a large set of compounds is a very tedious job, several methods of calculations of logPo/w values have been proposed by different groups of authors, e.g., Rekker et al. [7], Leo et al. [8, 9], Crippen et al. [10, 11], Bodor et al. [12], Klopman et al. [13], Moriguchi et al. [14], and Suzuki et al. [15]. Many studies on the modeling of logPo/w values using topological, topographic, quantum chemical, and other descriptors have been reported where logPo/w values have been the response variable to explore suitability of the descriptors/schemes in QSPR studies [16-22].
There are some reports about the applications of ANN [23-26] modeling to predict the n-octanol /water partition coefficient of organic compounds. In our previous papers, we reported on the application of QSPR techniques in the development of a new, simplified approach to prediction of compounds properties [27-31]. Experimental determination of logPo/w is often complex and time-consuming and can be done only for already synthesized compounds. For this reason, a number of computational methods for the prediction of this parameter have been proposed. In this work a QSPR study is performed, to develop models that relate the structures of a heterogeneous group of 150 drug compounds to their n-octanol-water partition coefficients. The genetic algorithm was used to select the most informative descriptors from the calculated descriptors by Molecular Modeling Pro Plus software. The selected descriptors were used to develop an ANN model for predicting the logPo/w for 40 drug compounds at 25 °C. The key aim of this work is to investigate molecular descriptors important in determining n-octanol-water partition coefficients.
Materials and methods
The QSPR model for the estimation of the logPo/w’s of various drug organic compounds is established in the following six steps: the molecular structure input and generation of the files containing the chemical structures is stored in a computer–readable format; quantum mechanics geometry is optimized with a semi–empirical (AM1) method; structural descriptors are computed; structural descriptors are selected; and the structure–logPo/w model is generated by the ANN and statistical analysis.
Data set
All logPo/w data for all 150 compounds was taken from the literature [32]. The data set was split into a training set (110 compounds) and a prediction set (40 compounds). The logPo/w’s of these compounds are deposited in Journal log as supporting material (see Table 1 and 2).
Table1. Experimental values of logPO/W for drug organic componds at 25 °C for training set.
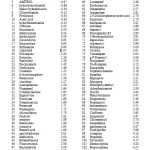 |
Table1: Experimental values of logPO/W for drug organic componds at 25 °C for training set. Click here to View table |
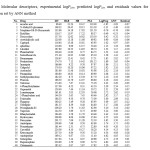 |
Table2: Molecular descriptors, experimental logPo/w, predicted logPo/w and residuals values for external prediction set by ANN method. Click here to View table |
Computer hardware and software
All calculations were run on a Dell Inspiron N5010 laptop computer with intel® Core™ i7 processor with Windows 7 operating system. The ChemDraw Ultra version 9.0 (ChemOffice 2005, CambridgeSoft Corporation) software was used for drawing the molecular structures [33]. The MOPAC 7.0 (AM1 method) did the optimizations of molecular structures and descriptors were calculated by Molecular Modeling Pro Plus (MMPP) Version 6.3.3 (ChemSW, Inc.) software’s [34, 35]. A genetic algorithm procedure was used for selection of descriptors using the STATISTICA Neural Networks software package [36] and other calculations were performed in the MATLAB (version 7.0, MathWorks, Inc.) environment.
Molecular modeling and theoretical molecular descriptors
The derivation of theoretical molecular descriptors proceeds from the chemical structure of the compounds. In order to calculate the theoretical descriptors, molecular structures were constructed with the aid of ChemDraw Ultra version 9.0 and molecular structures were optimized using AM1 algorithm [37, 38]. The computational chemistry software Chem3D Ultra version 9.0 with MOPAC was used to build the molecules and perform the necessary geometry optimizations. A gradient cutoff of 0.01 was used for all geometry optimizations. We have chosen descriptors associated with the neutral molecules of drug in our calculations. As a result, 67 theoretical descriptors were calculated for each compound in the data sets (150 compounds).
Genetic algorithm for descriptor selection
The selection of relevant descriptors, which relate the logPo/w to the molecular structure, is an important step to construct predictive models. The genetic algorithm was applied to the input set of 67 molecular descriptors for each chemical of the studied data sets and the related response, in order to extract the best set of molecular descriptors, which are, in combination, the most relevant variables in modeling the response of the training set chemicals. Genetic algorithm (GA), included in the STATISTICA Neural Networks, was used for variables selection (based on the training set) [39]. The population size was 100, maximum generation was set to 100, double crossover was set to 0.3 and a mutation rate of 1.0 was used. Finally, we obtained a 4-descriptor subset, which keeps most interpretive information for logPo/w. A total of 4 descriptors were calculated for each drug in the data set. The selected descriptors are molecular volume (MV), hydrophilic–lipophilic balance (HLB), Hansen’s hydrogen bond forming ability (HB) and polar surface area (PSA).
Artificial Neural Network
An artificial neural network (ANN) or commonly just neural network (NN) is an interconnected group of artificial neurons that uses a mathematical model or computational model for information processing based on a connectionist approach to computation. In most cases an ANN is an adaptive system that changes its structure based on external or internal information that flows through the network [40]. We use a three-layer neural network with a number of neurons in the input layer equal to the number of parameters, a variable number of neurons in the hidden layer and one neuron in the output layer. The training of the neural network is done by the back-propagation algorithm [41] using a STATISTICA Neural Networks software. Back propagation is the best known training algorithm for neural networks, and still one of the most useful. Back-propagation is a gradient descent on the error surface, the weights of the connections between neurons being adjusted in order to decrease the root mean squared error (rmse) between calculated and expected values for all molecules in the database. A back propagation ANN (multilayer perceptron or MLP) was selected as an empirical model.
Our inputs consist of variables describing the structure, and our target data are values of logPo/w; thus, a supervised learning method should be used. In this study, we will try to find a model that can predict the logPo/w for each set of the four input variables, MV, HLB, HB and PSA for any drug compounds. Hence, our network requires four input units and one output neuron. As in most applications, one hidden layer turns out to be sufficient; after some trial and error, 4 neurons were placed into the hidden layer. The (4-4-1) neural network (see Figure1), with one hidden and output layer was trained with 110 drugs by the back propagation algorithm.
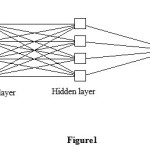 |
Figure1: Network architecture for studying the logPo/w of drug. Click here to View Figure |
Results and discussion
All descriptors were calculated for the neutral species. The logPo/w is assumed to be highly dependent upon the MV, HLB, HB and PSA. The correlation coefficients between experimental logPo/w and the MV, HLB, HB and PSA are 0.6777, -0.8893, -0.8058 and -0.7512, respectively. In the present study, the QSPR model was generated using a training set of 110 molecules. The test set of 40 molecules (Table 2) with regularly distributed logPo/w values was used to assess the predictive ability of the QSPR model produced in the ANN modeling.
ANN analysis
The logPo/w data and molecular descriptors were divided into training (110) and test (40) data sets. A selection of 110 compounds of the remaining 150 compounds made up the training set. A small number of molecular descriptors (MV, HLB, HB and PSA) proposed were used to establish a QSPR model.
For evaluation of the predictive power of the generated ANN, the optimized model was applied for prediction of logPo/w values of 40 compounds in the prediction set which were not used in the optimization procedure. For the constructed model, the predictive ability of the ANN model was evaluated by calculation of statistical parameters.
The molecular descriptors, experimental logPo/w, predicted logPo/w and residuals values for external prediction set by ANN method are presented in Table 2. The plots of predicted logPo/w versus experimental logPo/w and the residuals (experimental logPo/w – predicted logPo/w) versus experimental logPo/w value, obtained by the ANN modeling, and the random distribution of residuals about zero mean are shown in Figure 2. The stability and validity of model was tested by prediction of the response values for the prediction set. This model is applicable for prediction of logPo/w from -1.85 to 5.20.
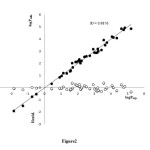 |
Figure2: Plots of predicted logPo/w and residuals logPo/w estimated by ANN modeling versus experimental logPo/w for test molecules in prediction. Click here to View Figure |
The average relative errors (RE/%) of prediction for ANN is -0.0087%. The optimal back-propagation neural network for logPo/w had a 4-4-1 architecture (Figure 1) was chosen to correlate weighted inputs and outputs of the hidden layer. The optimal neural network architecture was then tested using test data subset as described above.
Interpretation of Descriptors
The QSPR developed indicated that molecular volume (MV), hydrophilic-lipophilic balance (HLB), hydrogen bond forming ability (HB) and polar surface area (PSA) significantly influence drug n-octanol/water partition coefficients.
The molecular volume and the molecular surface area are used mostly as bulk/cavity terms. There is no unique way to define the molecular volume or surface area, but most approaches try to define a surface contour similar to the vander Waals volume. Molecular volume determines transport characteristics of molecules, such as intestinal absorption or blood-brain barrier penetration. Volume is therefore often used in QSPR studies to model molecular properties and biological activity. The steric effects characterize bulk properties of a molecule and can be described with molecular volume. The molecular volume is clearly the most important descriptor for logPo/w. In order for a solute to enter into aqueous solution, a cavity must be formed in the solvent for the solute molecule to occupy. Water as a solvent would much prefer to interact with itself or other hydrogen bonding or ionic species than with a non-polar solute, so there is an increasing penalty (and thus higher logPo/w) for larger solutes. By increasing molecular volume leads to increasing cavity formation energy in water, the larger the solute, the greater the energy demand to make cavity and the lower the solubility in water. According to, increasing the MV increases extent of logPo/w of the drug organic compounds.
A parameter of utmost importance in the development of pharmaceutical emulsions is the evaluation of their critical hydrophilic-lipophilic balance (HLB). A number on the scale of one to 40 according to the HLB system, introduced by W.C. Griffin [42, 43]. The HLB system is based on the concept that some molecules have hydrophilic groups, other molecules have lipophilic groups, and some have both.
Hydrophilic compounds have a high HLB value (generally over 10), whereas lipophilic compounds have values ranging from 1 to 10. Compounds with self-balance between their lipophilic and hydrophilic portions are extremely efficient as emulsifying agents because they tend to concentrate at the oil/water interface.The Hydrophilic-lipophilic balance of a compounds is a measure of the degree to which it is hydrophilic or lipophilic, determined by calculating values for the different regions of the molecule, as described by Griffin in 1949 and 1954. Griffin’s method for non-ionic compounds as described in 1954 works as follows:
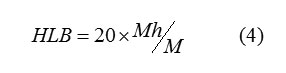
where Mh is the molecular mass of the hydrophilic portion of the Molecule, and M is the molecular mass of the whole molecule, giving a result on an arbitrary scale of 0 to 20. An HLB value of 0 corresponds to a completely hydrophobic molecule, and a value of 20 would correspond to a molecule made up completely of hydrophilic components. The lower the HLB number the more oil soluble the product; and in turn the higher the HLB number the more water-soluble the product. The results indicate that the HLB increases as logPo/w decreases.
Hydrogen-bonding may be divided into an electrostatic term and a polarization/charge transfer term. A particularly strong type of polar interaction occurs in molecules where a hydrogen atom is attached to an extremely electron-hungry atom such as oxygen, nitrogen, or fluorine. In such cases, the hydrogen’s sole electron is drawn toward the electronegative atom, leaving the strongly charged hydrogen nucleus exposed. In this state the exposed positive nucleus can exert a considerable attraction on electrons in other molecules, forming a protonic bridge that is substantially stronger than most other types of dipole interactions. This type of polarity is so strong compared to other van der Waals interactions, that it is given its own name: hydrogen bonding. Understandably, hydrogen bonding plays a significant role in solubility behavior. Hydrogen bonding not a true bond, but a very strong form of dipole-dipole attraction. The O-H and N-H bonds in molecular structures are strongly polarized and the positive charge is located on Hδ+. In this study, we have a dipolar protic solvent (water) containing hydrogen bond donor (O-H bonds) and hydrogen bond acceptor (lone pairs of oxygen atom). Hydrogen bond donor solutes are simply those containing a hydrogen atom bound to an electronegative atom. Hydrogen bond acceptors solutes are that have a lone pair available for donation, and include N and O atoms in their structures. The hydrogen bonding (Hansen) a measure of the tendency of a molecule to form hydrogen bonds. Intermolecular hydrogen bonds can decrease the hydrophobicity (logPo/w) of a molecule, but identifying the existence of hydrogen bonds between a compound and water. This is easy to understand since a large hydrogen bond forming value means that the corresponding solute can provide more hydrogen bond acceptor sites and/or hydrogen bond donor sites As the hydrogen bond formation increases, water solubility increases (or n-octanol solubility decreases), this is agreed to the fact that water has large dipolarity/polarizability. The intermolecular hydrogen bonding can dramatically influence solubility properties.
The Polar Surface Area (PSA) is defined as the surface sum over of polar atoms, e.g. oxygen, nitrogen, etc, as well as hydrogen atoms attached to them. PSA is a commonly used medicinal chemistry metric for the optimization of cell permeability. Molecules with a greater polar surface area are usually believed to be poor at permeating cell membranes. For molecules to penetrate the blood-brain barrier, PSA should be small. This quantity has been used successfully to correlate and predict several transport properties of drugs. The polar surface area term reflect electrostatic and polarization interactions between the solute and the solvent. These interactions are dipole and induced-dipole interactions, together with higher multipole analogues. Therefore, it seems natural to design descriptors based on the electrostatic potential, which gives a complete description of molecular charge distribution, to investigate these properties. Molecular polar surface area is calculated based on the methodology published by Ertl et al. [44] as a sum of fragment contributions. O- and N- centered polar fragments are considered. PSA has been shown to be a very good descriptor characterizing drug absorption, including intestinal absorption, bioavailability and blood-brain barrier penetration. The results indicate that the PSA increases as logPo/w decreases.
Statistical parameters
For evaluation of the predictive power of the generated ANN, the optimized models were applied for prediction of logPo/w values of test compounds in the prediction set, which were not used in the optimization procedure. For the constructed models, four general statistical parameters were selected to evaluate the prediction ability of the model for logPo/w. For this case, the predicted logPo/w of each sample in prediction step was compared with the experimental logPo/w.
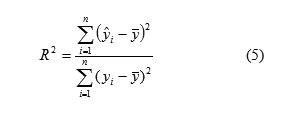
R-Squared ranges from zero to one. The correlation coefficient values closer to 1 represents the better fit of the model. The square of the correlation coefficient (R2), which is, indicated the quality of fit of all the data to a straight line is calculated for the checking of test set, and is calculated as
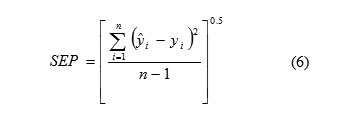
The predictive applicability of a regression model is described in various ways. The most general expression is the standard error of prediction (SEP) which is given in the following formula
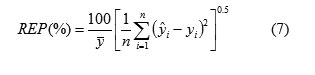
The third statistical parameter was relative error of prediction (REP) that shows the predictive ability of each component, and is calculated as
Root mean square error of prediction (RMSEP) is a measurement of the average difference between predicted and experimental values, at the prediction stage. RMSEP can be interpreted as the average prediction error, expressed in the same units as the original response values. The RMSEP was obtained by the following formula
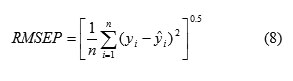
where is the experimental logPo/w of the drug in the sample i , represented the predicted logPo/w of the drug in the sample i , , is the mean of experimental logPo/w in the prediction set and n is the total number of samples used in the prediction set.
The statistical parameters values of R2,SEP, REP (%) and RMSEP of prediction set for the ANN model are shown in
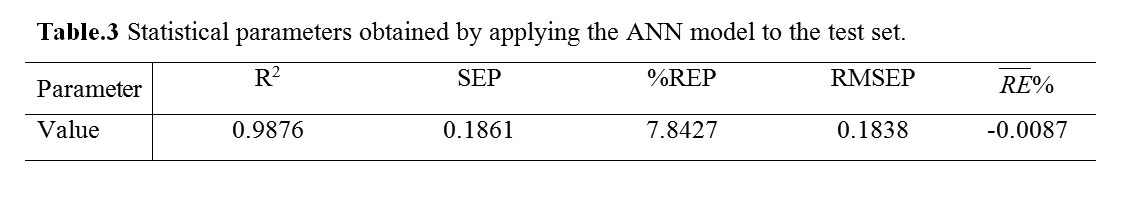 |
Table 3: Statistical parameters obtained by applying the ANN model to the test set. Click here to View table |
Conclusions
Results of this study reveal that ANN can be used successfully in development of a QSPR model to predict the n-octanol/water partition coefficients of heterogeneous set of drug organic compounds. Descriptors appear in these QSPR model provide some information related to different molecular properties, which can participate in the intermolecular interactions that affected on the n-octanol/water partition coefficients. The good agreement between experimental results and predicted values confirms the validity of obtained model. The calculated statistical parameters of these models reveal the superiority of ANN model. The result shows that ANN model can describe accurately the relationship between the structural parameters and n-octanol/water partition coefficients of drug compounds. This procedure allowed us to achieve a precise and relatively fast method for determination of logPo/w of different series of drug compounds and to predict with sufficient accuracy the logPo/w of new drug derivatives.
References
- C. D. Selassie, D. J. Abraham, In Burger’s Medicinal Chemistry and Drug Discovery, Wiley, New Jersey, 2003.
- R. Franke, Theoretical Drug Design Methods, Elsevier, Amsterdam, 1984.
- P. J. Taylor, C. Hansch, P. G. Sammes, J. B. Taylor, In Comprehensive Medicinal Chemistry, Pergamon Press, Oxford, 1990.
- A. Martin, P. Bustamante, A. H. C. Chun, Physical Pharmacy, Lippincott, Williams and Wilkins, Baltimore, 2001.
- A. K. Debnath, A. K. Ghose, V. N. Viswanadhan, In Combinatorial Library Design and Evaluation, Marcel Dekker, New York, 2001.
- P. C. Jurs, S. L. Dixon, L. M. Egolf, In Chemometric Methods in Molecular Design, Waterbeemd, VCH, Weinheim, 1995.
- R. F. Rekker, The Hydrophobic Fragment Constants. Its Derivation and Applications. A Means of Characterizing Membrane Systems, Elsevier, Amsterdam, 1977.
- N. Tayar, R. S. Tsai, B. Testa, P. A. Carrupt, A. Leo , J. Pharm. Sci. 80 (1991) 590.
- C. Hansch, A. Leo, Exploring QSAR. Fundamentals and Applications in Chemistry and Biology, American Chemical Society, Washington DC, 1995.
- A. K. Ghose, G. M. Crippen, J. Chem. Inf. Comput. Sci. 27(1987) 21.
- A. K. Ghose, V. N. Viswanandhan, J. J. Wendoloski, J. Phys. Chem. 102(1998) 3762.
- N. Bodor, Z. Gabanyi, C. K.Wong, J. Am. Chem. Soc. 111 (1989) 3783.
- G. Klopman, S. Wang, J. Comput. Chem. 12 (1991) 1025.
- I. Moriguchi, S. Hirono, Q. Liu, I. Nakagome, Y. Matsushita, Chem. Pharm. Bull. 40 (1992)127.
- T. Suzuki, Y. Kudo, J. Comput. Aided Mol. Des. 4 (1990)155.
- L. B. Kier, L. H. Hall, Molecular Connectivity in Chemistry and Drug Research, Academic Press, New York, 1976.
- A. K. Saxena, Quant. Struct.-Act. Relat. 14 (1995)142.
- M. Mandloi, A. Sikarwar, N. S. Sapre, S. Karmakar, P. V. Khadikar, J. Chem. Inf. Comput. Sci. 40 (2000)57.
- W. H. Vaes, E. U. Ramos, H. J. Verhaar, C. J. Cramer, J. L. Hermens, Chem. Res. Toxicol., 11 (1998)847.
- E. Estrada, E. Molina, J. Chem. Inf. Comput. Sci. 41(2001)791.
- Q. Du, G. A. Arteca, J. Comput. Aided Mol. Des.10 (1996)133.
- K. Roy, A. Saha, Internet Electron. J. Mol. Des. 2(2003)288.
- J. J. Huuskonen, D. J. Livingstone, I. V. Tetko, J. Chem. Inf. Comput. Sci. 40 (2000)947.
- I. V. Tetko, V. Y. Tanchuk, A. E. P. Villa, J. Chem. Inf. Comput. Sci. 41(2001)1407.
- L. Molnar, G. M. Keseru, A. Papp, Z. Gulyas, F. Darvas, Bioorg. Med. Chem. Lett. 14(2004)851.
- A. F. Duprat, T. Huynh, G. Dreyfus, J. Chem. Inf. Comput. Sci. 38 (1998)586.
- J. Ghasemi, S. Saaidpour, S.D. Brown, J. Mol. Struct. (Theochem) 805 (2007) 27-32.
- J. Ghasemi, S. Saaidpour, Chem. Pharm. Bull. 55 (2007) 669-674.
- J. Ghasemi, S. Saaidpour, J. Incl. Phenom. Macrocycl. Chem. 60 (2008) 339-351.
- J. Ghasemi, S. Saaidpour, QSAR Comb. Sci. 28 (2009) 1245-1254.
- J. Ghasemi, S. Saaidpour, J. Chromatogr. Sci. 47 (2009) 156-163.
- A. Avdeef, Absorption and drug development: solubility, permeability, and charge state, John Wiley & Sons, Inc., 2003.
- ChemOffice 2005, CambridgeSoft Corporation, Web:http://www.cambridgesoft.com.
- Web:http://www.psu.ru/science/soft/winmopac/.
- Web: http://www.chemsw.com /.
- Web: http://www.statsoft.com/.
- M. J. S. Dewar, E.G. Zoebisch, E. F. Healy, J. J. P. Stewart, J. Am. Chem. Soc. 107(1985)3902.
- D. C. Young, Computational Chemistry, John Wiley & Sons, Inc., 2001.
- D. E. Goldberg, Genetic Algorithms in Search, Optimization and Machine Learning, Kluwer Academic Publishers, Boston, 1989.
- J. Zupan, J. Gasteiger, Neural Networks for Chemistry, VCH, Weinheim, 1993.
- D. Rumelhart, G. E. Hinton, R. J. Williams, Nature 323(1986)533.
- W.C. Griffin, J. Soc. Cosmetic Chem. 1(1949)311.
- W.C. Griffin, J. Soc. Cosmetic Chem. 5 (1954)249.
- P. Ertl, B. Rohde, P. Selzer, J. Med. Chem. 43 (2000)3714.

This work is licensed under a Creative Commons Attribution 4.0 International License.
![]()
A New Edition of Web of Science
Journal Impact Factor
2022: 0.5
Five Year: 0.8
Journal is Indexed in

Cabells Whitelist
![]()


