Extractive Spectrophotometric Determination of Mirtazapine in Pure and Pharmaceutical Forms
1Department of Chemistry, SAP College, Vikarabad -501 101 Ranga Reddy Dist. Andhra Pradesh, India
2Department of Chemistry, JNTUH College of Engineering, Kukatpally, Hyderabad-500 085, Andhra Pradesh, India
DOI : http://dx.doi.org/10.13005/ojc/300244
Download this article as:
![]()
Four simple and sensitive extractive spectro photometric methods have been described for the assay of Mirtazapine either in pure form or in pharmaceutical formulations. The developed methods involve formation of coloured chloroform extractable ion-pair complexes of the drug with bromocresol green (BCG), bromophenol blue (BPB), bromothymol blue (BTB) and bromocresol purple (BCP) in acidic medium. The extracted complexes showed absorbance maxima at 417, 405, 412 and 405nm with use of the cited reagents, respectively. The stoichiometry of the complex is found to be 1:1 in each case. Beer’s law is obeyed in the concentration ranges 2.0-25, 2.0-25, 2.0-25, 2.5-25 μg/ml with BCG, BPB, BTB and BCP respectively. The effect of concentration of dye, pH, and interference of excipients have been studied and optimized. The limits of detection and quantification have been determined for four methods. All the four methods are validated as per the guidelines of ICH. The methods are applied to the determination of drug in commercial tablets and results of analysis are validated statistically through recovery studies.
KEYWORDS:Spectrophotometry; Mirtazapine; Bromothymol blue; Bromophenol blue; Bromocresol purple; Bromocresol green; Ion-pair complex; Validation
INTRODUCTION
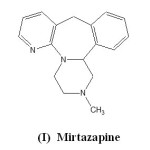
Mirtazapine, chemically, 1,2,3,4,10,14b-hexahydro-2-methyl pyrazino [2,1-a] pyrido [2,3-c] benzazepine (I) has a tetracyclic chemical structure and belongs to the piperazine-azepine group of compounds. It is a potent antagonist of histamine (H1) receptors, a property that explains prominent sedative effects1. Mirtazapine is a moderate peripheral adrenergic antagonist, a property that explains the occasional othostatic hypotension reported in association with its use. Mirtazapine is a moderate antagonist at muscarinic receptors, a property that explains the relatively low incidence of anti-cholinergic side effects associated with its use2.
 |
Scheme 1 A Click here to View Scheme |
The literature survey reveled that several analytical techniques like HPLC3-5, LC6,7, GC-MS8, GCTDMS9, RP-HPLC10, HPLC-MS11,12, Capillary electrophoresis13 and UV derivative spectrometry14,15 have been reported for its determination. Although, UV-vis spectrophotometric methods for the determination of Mirtazapine are available, a little attention was paid to the development of spectrophotometric methods for its determination using dyes. A report for the determination of Mirtazapine using fast sulphone Black F as chromogenic reagent is available in the literature16. Spectrophotometry is considered as the most convenient analytical technique because of its inherent simplicity, low cost and wide availability in most quality control laboratories. So the present study reports newly developed and validated spectrophotometric estimation methods of Mirtazapine in bulk and pharmaceutical formulations using triphenyl methane dyes viz., bromocresol green (BCG), bromophenol blue (BPB), bromothymol blue (BTB) and bromocresol purple (BCP). The developed methods involve formation of coloured chloroform extractable ion-pair complexes of the drug with dyes in acidic medium. The proposed methods have the advantages of speed and simplicity besides being accurate and precise, and can be adopted by the pharmaceutical laboratories for industrial quantitative analysis.
EXPERIMENTAL
Instruments
The spectra of ion-pair complexes of the drug ( Fig. 1a -1d)) were recorded on ELICO SL 210 UV-Visible double beam spectrophotometer using quartz cells of 10 mm path length. An Elico model Li-120 pH meter was used for pH measurement.
Materials and Methods
HPLC grade chloroform and Analytical grade dyes viz., a) BCG b) BPB c) BTB and d) BCP were used in the study. Other chemicals used in the study such as HCl, Sodium acetate are of AR grade and supplied by Sd Fine Chemicals, Mumbai. The drug, Mirtazapine was procured from Hetero Drugs Private Limited, Hyderabad, as gift sample.
The developed methods are based on the interaction of Mirtazapine with dyes viz., Bromocresol green (BCG), Bromophenol blue (BPB), Bromothymol blue (BTB) and Bromocresol purple (BCP) respectively, to form chloroform extractable ion pair complexes (Scheme 1) which absorb around 416 nm. The extracted complexes showed absorbance maxima at 417, 405, 412 and 405nm with use of the cited dyes respectively (Fig. 1a, 1b, 1c and 1d).
![Fig 1a. Absorption spectrum of Mirtazapine-bromothymol blue(BTB) complex extracted into 10 ml chloroform [drug] = 25 g ml-1 + 5 ml of 0.025% BTB + 5 ml of pH 2.8 buffer](https://www.orientjchem.org/wp-content/uploads/2014/04/Vol30_No2_Extr_RAVI_Fig1-150x150.jpg) |
Fig 1A : Absorption spectrum of Mirtazapine-bromothymol blue(BTB) complex extracted into 10 ml chloroform [drug] = 25 mg ml-1 + 5 ml of 0.025% BTB + 5 ml of pH 2.8 buffer |
![Fig 1b. Absorption spectrum of Mirtazapine-bromophenol blue(BPB) complex extracted into 10 ml chloroform [drug] = 25 g ml-1 + 5 ml of 0.025% BPB + 5 ml of pH 2.5 buffer](https://www.orientjchem.org/wp-content/uploads/2014/04/Vol30_No2_Extr_RAVI_Fig1b.jpg) |
Fig 1 B: Absorption spectrum of Mirtazapine-bromophenol blue(BPB) complex extracted into 10 ml chloroform [drug] = 25 mg ml-1 + 5 ml of 0.025% BPB + 5 ml of pH 2.5 buffer |
![Fig 1c. Absorption spectrum of Mirtazapine-bromocresol purple (BCP) complex extracted into 10 ml chloroform [drug] = 25 g ml-1 + 5 ml of 0.025% BCP + 5 ml of pH 2.5 buffer](https://www.orientjchem.org/wp-content/uploads/2014/04/Vol30_No2_Extr_RAVI_Fig1c-150x150.jpg) |
Fig 1c. Absorption spectrum of Mirtazapine-bromocresol purple (BCP) complex extracted into 10 ml chloroform [drug] = 25 mg ml-1 + 5 ml of 0.025% BCP + 5 ml of pH 2.5 buffer |
![Fig 1d. Absorption spectrum of Mirtazapine-bromocresol green (BCG) complex extracted into 10 ml chloroform [drug] = 25 g ml-1 + 5 ml of 0.025% BCG + 5 ml of pH 3.5 buffer](https://www.orientjchem.org/wp-content/uploads/2014/04/Vol30_No2_Extr_RAVI_Fig1d-150x150.jpg) |
Fig 1d. Absorption spectrum of Mirtazapine-bromocresol green (BCG) complex extracted into 10 ml chloroform [drug] = 25 mg ml-1 + 5 ml of 0.025% BCG + 5 ml of pH 3.5 buffer |
The absorbance of this band increases with increasing the concentration of the drug and formed a basis for the quantification of the drug. The dyestuffs were used as 0.025% solutions in doubly distilled water. Sodium acetate-hydrochloric acid buffers of pH 3.5, 2.5, 2.8 and 2.5 were prepared by mixing 50ml of 1.0M sodium acetate solution with calculated volume of 1.0 M HCl solution and diluted to 250 ml with doubly distilled water17. The pH of each solution was adjusted to an appropriate value with the aid of a pH meter.
 |
Scheme 1 B Click here to View Scheme |
Calibration curves for the methods
Different aliquots of drug solution were transferred into 125 ml separating funnel. To this 5 ml of buffer, 5 ml of dye were added and total volume was made up to 20 ml with water. 10 ml of chloroform was added and the contents were shaken for 5 min. The two layers were allowed to separate for 5 min. The organic layer was separated and absorbance of yellow colored solution which is stable at least for 3 hrs is measured at 417 nm against blank similarly prepared. The same procedure of analysis is followed either for assay of pure drug or for dosage form. The calibration graphs are linear for all the dyes analysed using these methods (Fig. 2).
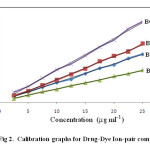 |
Fig 2: Calibration graphs for Drug-Dye Ion-pair complexes: Click here to View Figure |
The optical characteristics and statistical data for the regression equations for the proposed methods are presented in Table 1.
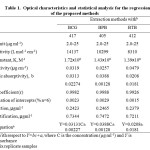 |
Table 1: Optical characteristics and statistical analysis for the regression equation of the proposed methods Click here to View table |
Procedure for the assay of pure drug
Five different solutions of pure drug in the range of calibration curve were selected and the recovery experiments were performed. The recoveries and their relative standard deviations are tabulated in Table 2.
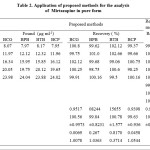 |
Table 2: Application of proposed methods for the analysis of Mirtazapine in pure form |
Procedure for the assay of dosage forms
Ten tablets of Mirtaz 30mg each are powdered and dissolved in doubly distilled water and stirred thoroughly, filtered through a Whatman No. 42 filter paper. This solution was transferred into 100 ml standard volumetric flask and diluted with doubly distilled water as required. Different solutions of drug in the range of calibration curve were chosen and the assay was estimated using the calibration curve. The results of the recovery experiments are tabulated in Table 3.
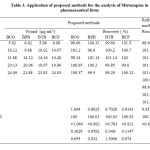 |
Table 3: Application of proposed methods for the analysis of Mirtazapine in pharmaceutical form: Click here to View table |
RESULTS AND DISCUSSION
Mirtazapine forms ion-pair complexes in acidic buffer with dyestuffs viz., BCG, BPB, BTB and BCP. These complexes, extracted into chloroform absorbed maximally at 417 nm. The reagent blank under similar conditions showed no absorption. The methylated nitrogen of piperazine ring in Mirtazapine is potential donor site and the protonation takes place at this site in acidic medium, while sulphonic acid group is present in any of the dyes that is the only group undergoing dissociation in the pH range 1-6. The colour of such dyes is due to the opening of lactoid ring and subsequent formation of quinoid group. It is supposed that the two tautomers are present in equilibrium but due to strong acidic nature of the sulphonic acid group, the quinoid body must predominate. Finally the protonated Mirtazapine forms ion-pairs with the dyestuffs which is quantitatively extracted into chloroform.
Stoichiometry
In order to establish molar ratio between Mirtazapine and dyestuffs used, the Job’s method of continuous variation has been applied18. In this method, solutions of drug and dyestuff with identical molar concentrations [8 x 10⁻⁵M] were mixed in varying volume ratios in such a way that the total volume of each mixture was the same. The absorbance of each solution was measured and plotted against the mole fraction of the drug, [drug]/[drug]+[dyestuff]. This measurement showed that 1:1 complex was formed (Fig. 3).
![Fig 3. Continuous-variations study of drug-dye systems [Drug] = [Dye] = 8x10-5M](https://www.orientjchem.org/wp-content/uploads/2014/04/Vol30_No2_Extr_RAVI_Fig3-150x150.jpg) |
Fig 3. Continuous-variations study of drug-dye systems [Drug] = [Dye] = 8×10⁻⁵M Click here to View Figure |
Optimization of the factors affecting the absorbance
The influence of pH on the ion-pair formation of Mirtazapine with various dyestuffs has been studied using sodium acetate-hydrochloric acid buffer. The results are shown in Fig.4. It is evident that absorbance of complexes with BCG, BPB, BTB and BCP was found to be constant within the pH ranges 2.2-3.8, 2.0-3.0, 2.0-3.0 and 2.0-3.0 respectively. Thus, all the absorbance measurements were made at pH 3.5, 2.5, 2.8 and 2.5 with BCG, BPB, BTB and BCP respectively.
![Fig. 4 Effect of pH [Drug] = [8µg ml-1, [Dye] = 5ml of 0.025%](https://www.orientjchem.org/wp-content/uploads/2014/04/Vol30_No2_Extr_RAVI_Fig4-150x150.jpg) |
Fig: 4 Effect of pH [Drug] = [8µg ml-1, [Dye] = 5ml of 0.025% Click here to View Figure |
The effect of dyestuff concentrations was also studied by adding different volumes of dyestuff to a constant amount of Mirtazapine (8 µg ml-1). It is apparent from Fig. 5 that the maximum absorbance, in each case, was found with 3.0 ml of dyestuff, beyond which absorbance was constant. Thus, 5 ml of each dyestuff was used for ion-pair formation throughout the experiment.
![Fig 5. Influence of the volume of 0.025% Dye [Drug] = [8µg ml-1]](https://www.orientjchem.org/wp-content/uploads/2014/04/Vol30_No2_Extr_RAVI_Fig5-150x150.jpg) |
Fig 5: Influence of the volume of 0.025% Dye [Drug] = [8µg ml-1] Click here to View Figure |
A systematic study of the effect of foreign species present along with Mirtazapine on its determination at 8 µg ml-1 levels was undertaken. This study was carried out by following the proposed procedures for a 10 ml sample system, by adding a known amount of foreign species to a Mirtazapine solution of 8 µg ml-1. Table 4 summarizes the results obtained. However, the drug content from the powdered capsules was extracted into chloroform, which completely removes any interference by the common excipients found in formulations.
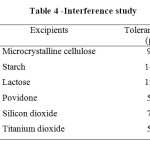 |
Table 4: Interference study |
Validation of the proposed method
All the four proposed methods have been validated in terms of guideline proposed by International Conference on Harmonization19 viz. selectivity, specificity, accuracy, precision, limits of calibration curve, LOD, LOQ, robustness, ruggedness and regression equation. The student t-test and variance F-test have been performed in comparison with a reference method. Table 1 summarizes the values for Beer’s law limits, molar absorptivity, regression equation, correlation coefficients, relative standard deviation and recoveries. To test the reproducibility of the proposed methods, six replicate determinations of 8µg ml-1 of Mirtazapine were made. The coefficient of variation was found to be less than 1.2% for all the procedures.
The proposed methods have been successfully applied to the determination of Mirtazapine in pharmaceutical preparations. The performance order of the proposed methods is BCG > BPB > BTB > BCP. The results obtained and shown in Table 2 and Table 3 were compared to those obtained by a reference method19 by means of t-test at 95% confidence level. In all cases, the average results obtained by proposed methods and reference method were statistically identical, as the difference between the average values had no significance at 95% confidence level.
Conclusion
In conclusion, Mirtazapine forms ion-pair complexes with acidic triphenylmethane dyes viz., bromocresol green, bromophenol blue, bromothymol blue and bromocresol purple and in 1:1 proportion. These complexes are extractable into chloroform and offer a basis for assay of the drug. The developed methods are simple, sensitive, reproducible and can be used for routine analysis of Mirtazapine in pure and formulation forms.
Acknowledgements
The authors are grateful to Prof. G. Venkateshwarlu, Department of Chemistry, Osmania University, Hyderabad for helpful discussion and to Sri M. Ravindra Reddy, Chairman, Managing Committee SAP College, Vikarabad for providing facilities. The authors are thankful to the UGC for financial assistance under Major Research Project.
REFERENCES
- Leonard B.E. Mirtazapine—Noradrenergic and specific serotonergic antidepressant (NaSSA). Hum. Psychopharm. 10(2): S81 (1995).
- Davis R., Wilde M.I. . Mirtazapine: A review of its pharmacology and therapy potential in the management of major depression. CNS Drugs 5: 389–402 (1996).
- Dodd S., Burrows G.D., Norman T.R., Chiral determination of mirtazapine in human blood plasma by high-performance liquid chromatography. J. Chrom. B Biomed Sci Appl., 748(2):439-443 (2000).
- Morgan P.E., Tapper J., Spencer EP. Rapid and sensitive analysis of mirtazapine & normirtazapine in plasma/serum by HPLC with fluorescence detection. J. Psychopharmacol. 16:A64-A64 (2002).
- Labat L., Dallet P., Kummer E., Dubost J. P. Development of Spectrofluorimetric and HPLC Methods for In vitro Analysis of Repaglinide, J. Pharm. Biomed. Anal., 28(2): 365-371 (2002).
- Santana F.J. M., Oliveira A.R.M., and Bonato P.S. Chiral liquid chromatographic determination of mirtazapine in human plasma using two-phase liquid-phase microextraction for sample preparation. Anal. Chim. Acta 549:96–103 (2005).
- Hulya Demirhan, Mustafa Arslan, Mustafa Zengin Mustafa, Determination of mirtazapine in human plasma by liquid chromatography, Biomedical and Life Sciences, 794(2):323-328 (2003).
- Bickeboeller-Friedrich J., Maurer H. H. Screening for detection of new antidepressants, neuroleptics, hypnotics, and their metabolites in urine by GC-MS developed using rat liver microsomes, Ther. Drug Monit, 23: 61-70 (2001).
- Paterson S., Cordero R., Burlinson S. Validation of a Gas Chromatography–Ion Trap-Tandem Mass Spectrometry Assay for the Simultaneous Quantification of Cocaine, Benzoylecgonine, Cocaethylene, Morphine, Codeine, and 6-Acetylmorphine in Aqueous Solution, Blood, and Skeletal Muscle Tissue. J. Chrom. B. Anal. Tech. Biomed. Life Sci., 813:323-330 (2004).
- Nageswararao R., NarasaRaju A. Development and validation of a reversed-phase HPLC method for separation and simultaneous determination of process-related substances of mirtazapine in bulk drugs and formulations, J. chromat science, 47(3):223-230 (2009).
- Kirchherr H., Kühn-elten W.N. Quantitative determination of forty-eight antidepressants and antipsychotics in human serum by HPLC, tandem mass pectrometry: amulti-level, single-sample approach, J. Chromatogr. B. AnalytTechnol., Biomed.LifeSci, 843(2):227-233 (2006).
- Pistos C., Koutsopoulou M., and Panderi I. A validated liquid chromatographic tandem mass spectrometric method for the determination of mirtazapine and demethylmirtazapine in human plasma: Application to a pharmacokinetic study. Anal. Chim. Acta, 514:15–26 (2004).
- Labat L., Deveaux M., Dallet P., Dubost J.P. Separation of new antidepressants and their metabolites by micellar electrokinetic capillary chromatography. J. Chromatogr. B 773: 17–23 (2002).
- Karaşen N., Altinöz S. Determination of mirtazapine in tablets by UV spectrophotometric and derivative spectrophotometric methods. J. Pharm Biomed Anal. 24(1): 11-17 (2000).
- Metreyi sharma, Mhaske Deepali V., Mahadik M., Kadam S. S. Dhaneshwar S. R. UV and Three Derivative Spectrophotometric Methods for Determination of Ezetimibe in Tablet Formulation, Indian J. Pharm Sci.,70(2):258–260 (2008).
- Murthy Ch. V.R., Acharyulu M.L.N., Reddy T.S., Srinivas B.V., Rao P.V.S.R. Mohana. Determination of Mirtazapine using fast sulphone back F as chromogenic reagent. Int. J. Res. Chem. & Environ. 3(2):107-112 (2013).
- Britton, HTS. Hydrogen Ions, Vol. I, Chapman and Hall, London, pp301 (1942).
- Vosburgh, W.C., and Coopper, G.R. The identification of complex ions in solution by spectrophotometric measurements. J Am Chem Soc, 63:437-442 (1941).
- ICH (International Conference on Harmonization) of Technical Requirement for the Registration of Pharmaceuticals for Human use, Validation of analytical procedures: definitions and Terminology Genera. 1996.


ISSN Online: 2231-5039

![]()


