Activated Carbon Prepared From Orange Peels Coated With Titanium Oxide Nanoparticles: Characterization and Applications in the Decomposition of NOx
Liliana Giraldo1, Juan Carlos Moreno-Pirajan2*
1Universidad Nacional de Colombia, Facultad de Ciencias, Departamento de Química, Carrera 30 No 43-00, Bogotá, Cundinamarca, 001/Colombia
2Universidad de los Andes, Facultad de Ciencias, Departamento de Química, Grupo de Investigación en Sólidos Porosos y Calorimetría, Carrera 1 No 18 A 10, Bogotá, Cundinamarca, 001/Colombia
DOI : http://dx.doi.org/10.13005/ojc/300207
Article Received on :
Article Accepted on :
Article Published : 16 Apr 2014
In this work, we report the degradation of NOx using two catalysts prepared by coating activated carbon from orange peels with TiO2. This study compared the performance of TiO2-coated catalysts prepared by CVD (AC1/TiO2) and the sol-gel method (AC2/TiO2). The catalysts were characterized by X-ray diffraction, BET surface area and TEM. The photocatalytic activity was measured by studying the degradation of NOx in the vapor phase. The results show that the catalyst synthesized by the CVD method was more efficient in the decomposition of NOx. TEM and XRD revealed the presence of a mixture of the anatase and rutile phases, which favors the NOx decomposition process. Nitrogen isotherms showed that coating the nanoparticles with titanium oxide did not significantly change the surface area of the original activated carbon.
KEYWORDS:photocatalysis; activated carbon; isotherms; NOx degradation
Download this article as:| Copy the following to cite this article: Giraldo L, Pirajan M. C. J. Activated Carbon Prepared From Orange Peels Coated With Titanium Oxide Nanoparticles: Characterization and Applications in the Decomposition of Nox. Orient J Chem 2014;30(2). |
| Copy the following to cite this URL: Giraldo L, Pirajan M. C. J. Activated Carbon Prepared From Orange Peels Coated With Titanium Oxide Nanoparticles: Characterization and Applications in the Decomposition of Nox. Orient J Chem 2014;30(2). Available from: http://www.orientjchem.org/?p=3059 |
INTRODUCTION
Research on pollutants and their sources that are emitted to the environment are very varied. The scientists must propose solutions to this problematic, which is an topic that today is a problem of great importance to society, problem that requires researchers with new ideas for propose the realization of solutions to the pollution control and ensure that ecosystems reach its natural balance. The research in the laboratories of the Universities have the fundamental idea that later can be applied to small-scale and large-scale later. Thus, it may in a short period of time, that the large part of the pollutants which are now environmentally hazardous, begin to decrease. Automotive traffic exhaust contains many hazardous gaseous pollutants, such as nitrogen oxides (NOx), which affect the health of people living in urban areas1,2. Reducing NOx concentrations is therefore important in order to promote sustainable development3,4. The oxides of nitrogen, NO and NO2 (NOx), have a variety of negative impacts on human and environmental health, ranging from serving as key precursors of the respiratory irritant ozone to forming nitric acid, which is a key component of acid rain. Hence, it is of great interest to develop approaches that irreversibly remove NOx from the atmosphere.
Industrial development in the past five decades has brought the planet to a very worrying collapse from the environmental point of view because of the uncontrolled increase in the use of fossil fuels as the main energy source; the average global temperature will increase and thereby alter the ecosystem. In particular, the excess emission of gases from the internal combustion engine and industry has become one of the major causes of environmental pollution, where gases such as CO2, CO, hydrocarbons, SO2, and NOx generate volatile organic compounds (VOC) and particulate matter. These compounds have led to the greenhouse effect, acid rain, photochemical smog, stratospheric ozone depletion, and the aforementioned global warming. These events impose considerable negative effects on human and animal health due to the high toxicity of the compounds mentioned1,2. Nitrogen compounds such as nitrogen oxides (NOx) and sulfur (SOx), which are considered the most toxic gases, are emitted into the atmosphere during the combustion of fossil fuels. To reduce these emissions, several studies have used porous materials such as mesoporous materials, modified mesoporous materials, aluminas, silicon compounds, compounds derived from coal as both chemically and physically activated powders, granular materials, and fabrics modified with TiO25,6. Nitrogen oxide (NOx) emissions into the atmosphere have a direct impact on the global environment and human health through ozone depletion, photochemical smog and acid deposition1-3. The wet scrubbing method is an efficient and economical way to remove soluble pollutants3. In order to remove NOx by the wet scrubbing method, it is necessary to oxidize nitric oxide (NO) into the more soluble nitrogen dioxide (NO2) or dinitrogen pentoxide (N2O5) in either the gas or liquid phase4-9. However, it is very difficult to oxidize dilute NO without the addition of strong oxidants such as methanol, ozone and hydrogen peroxide5–10.
For several decades, it has been known that heterogeneous photocatalysis represents an emerging environmental control option for the efficient removal of chemical pollutants, as it can be applied to water and air purification. This process involves a nano-solid semiconductor catalyst, usually titanium dioxide (TiO2), which is activated with ultraviolet light at the appropriate wavelength. For various reasons, titanium dioxide in the anatase form has been the preferred choice due to its strong oxidizing power under UV irradiation, its chemical stability and the absence of toxicity11. These reactions are very attractive for treating pollution because: (1) in the vast majority of cases pollutants are transformed into innocuous products11,12 and (2) the process has very low selectivity, thus permitting the treatment of a wide range of contaminants. Nowadays, smog is still problematic. Researchers have dedicated their time to studying the dynamics of the photocatalysis of nitrogen oxides. While some have focused on NOx control methodology by the reduction to NOx to N211,13, another approach is to oxidize NO to NO2 and HNO3 along the general direction of nitrogen fixation. Photocatalytic oxidation (PCO) of NOx offers the following important advantages: (1) no extra reactants are required and (2) NOx is recycled or recovered as nitric acid, a potential raw material for fertilizers. The scientific literature has reported a number of interesting publications on the treatment of NOx with TiO2, so photodegradation for this compound. There are also interesting publications in which kinetic studies have been carried out on the possible mechanisms of the TiO2 photocatalytic reaction with NOx11,17. Several researchers11,14 have discovered that, during the photodegradation process, interaction with certain pollutant molecules or their intermediates can cause the TiO2 powder to coagulate, thereby reducing the amount of UV radiation able to reach TiO2 active centers (due to a reduction in surface area), thus reducing its catalytic effectiveness11. In order to overcome this coagulation problem, some researchers have used different materials as a support for the titania photocatalyst. Various substrates have been used as a catalyst support for the photocatalytic degradation of polluted water. From a survey of the literature, we can establish certain criteria for selecting an optimal catalyst support. The supporting material should be transparent or at least allow some UV radiation to pass through it and be chemically inert or non-reactive to pollutant molecules, its intermediates and the surrounding aqueous system. The supporting material should sufficiently bond either via physically or chemically to TiO2 without reducing the reactivity of titania. The supporting material should have a high surface area and a strong adsorption affinity for the pollutants (organic or inorganic compounds) to be degraded. This criterion reduces or eliminates the intermediates produced during the photocatalytic degradation while further increasing mass transfer rates and processes for efficient photodegradation. The supporting material should also allow for fast and easy photocatalyst recovery and re-use with or without regeneration. Based on these criteria, activated carbon (AC) has been extensively researched and used as a support material for TiO211,16,17.
Besides being used as a catalyst support, some researchers have used TiO2 and AC mixtures to treat pollutants. The literature reports some benefits of AC supports in the preparation of titania photocatalysts. A greater AC content in the supported photocatalyst translates to a higher surface area for the supported photocatalyst and higher adsorption capacity. The pore volume of AC is directly proportionate to the amount of AC in the catalyst11, indicating that TiO2 particles actually agglomerate on the carbon surface without being adsorbed into the carbon pores. However, pore trapping may still occur to a small extent. An AC content less than 13% of the supported photocatalyst weight will create a homogeneous distribution of TiO2 on the surface11,18. A heterogeneous distribution will occur if the percentage of the carbon is greater than 13%, causing both the AC and TiO2 particles to form conglomerates. Organic compounds are hydrophobic, whereas TiO2 particles, when exposed to UV radiation, are hydrophilic. Using AC as a photocatalyst support will help bring the pollutant molecules closer to the TiO2 active site (to come in contact with hydroxyl radicals) for an efficient and effective photodegradation process (synergistic effect). AC can generate new adsorption centers to favor approaching pollutant molecules. Using activated carbon as a support will also enable secondary degradation of intermediates to take place in situ, further enhancing the effectiveness of the photocatalyst. Moreover, using AC as a support allows for fast and easy photocatalyst recovery and provides ample room for catalyst regeneration using various techniques11-16,18. This is because the supported photocatalyst can be made into a granular form, providing an easy filtering option for recovery from the slurry11. Besides possessing all the criteria and benefits of a catalyst support as established in the literature survey, AC is non-polar, non-reactive, highly adsorptive and cheap to manufacture or purchase.
The purpose of the present work was to prepare AC from orange peel under specific conditions in the lab and to deposit on its surface nanoparticles of TiO2 using two different techniques, with the purpose of comparing its performance in the decomposition efficiency of NOx.
METHODS AND EXPERIMENTAL
Materials
AC was prepared as reported in our previously published work19. Prior to use, the orange peel was repeatedly washed with distilled water in order to remove dust and other inorganic impurities, then oven-dried for 24 h at 393 K to reduce the moisture content and milled to a size < 1 mm. Peels from Colombian oranges were impregnated with an aqueous solution of KOH following a variant of the incipient wetness method; similar cases have been described in the literature19-27. This consists of adding dropwise (while stirring the solid, to facilitate homogeneous absorption of the liquid) a specific amount of the aqueous solution (2.0 mL g−1 orange peel) necessary to produce swelling until incipient wetness. In this study, the concentration of KOH in the aqueous solution was 160 wt%, which was expressed as the impregnation ratio (Xp, wt.%), defined as (g KOH per g orange peel)×100. After impregnation, the samples were dried for 8 h at 383 K in air. Pyrolysis treatment (activation) was carried out in a vertical tubular reactor made of quartz in a Carbolite™ furnace, in all cases using 25 g of the impregnated and dried material. All treatments were performed at a constant heating rate of 10 K min−1 and with an argon (99.999% pure) flow of 30 STP cm3.min−1, which was maintained during heating and cooling. An activation temperature of 823 K and a soaking time of 4 h were used. After cooling the solid pyrolysis residue to room temperature, it was washed with Milli-Q distilled water until the conductivity of the washing liquid was lowered to <5 μS cm−1 (measured using a pH/conductivity meter; HP, model MARK 602). The resulting ACs was dried at 383 K for 24 h in a vacuum furnace.
Preparation of the photocatalyst samples
Chemical vapor deposition (CVD) method
This experiment was based on the work of Ding et al.28 and Amjad et al.29. We have designed and built a system based on publications by other authors by making some adjustments to improve the variability of the equipment.
The reactor for CVD synthesis consisted of a quartz tube that was made of this material due to its chemical inertia during the evaporation of the reagent, which was inserted into a tubular furnace in order to obtain the desired coating temperature. As the particles of the support were quite small and as there was no means to support them, we designed and adapted a porous glass plate for the final part of the reactor that holds the activated carbon during the reaction and promoting the free passage of vapors. Seven milliliters of titanium tetra iso-propoxide (TTIP) were placed in flask (a) of the reactor, while another container (b) was kept empty and immersed in an ice bath. The containers (a) and (b) were heated using two adjacent boiling water baths, which were heated before placing flasks (a) and (b), and kept under an inert atmosphere of nitrogen gas flowing through the system at a 1.7 L/min. This flow rate was sufficient to cause continuous movement of the particles inside the second flask to ensure homogeneity. When all the TTIP was consumed, water baths were switched off and the nitrogen flow was kept on until the system reached room temperature. The sample was then washed three times with distilled water to remove any suspended undeposited titanium hydroxide. The sample was then dried at 150°C overnight, then calcined for 3 h at 600°C to produce the anatase form of titanium dioxide. This procedure was followed has been reported in the literature28,29. This sample was designated AC1/TiO2.
Sol–gel impregnation method
A nano-sized binary mixed oxide of AC/TiO2 was prepared by the sol–gel impregnation method30. The synthetic procedure followed a typical sol–gel impregnation method to prepare a 1:1 molar composition of AC/Ti mixed oxide. Under constant magnetic stirring, 7.6 mL of titanium tetraisopropoxide were added dropwise to a beaker containing 25 mL of isopropanol and 1.5 mL HCl, while the beaker was maintained at 0°C. In another beaker, 8.2 mg of AC were suspended in 25 mL of isopropanol and then was mixed dropwise into the first beaker with vigorous stirring. The mixture was then stirred at 25°C for 48 h. The mixed sol was then sonicated in an ultrasonicator (up 200 s, Hielscher, Germany) at room temperature for 30 min. The sonicated sol was placed over a hotplate to remove the solvent. The resulting powder was calcined at a specific temperature and time. Nano-sized titanium dioxide was prepared using a similar approach.
Under constant magnetic stirring, 7.6 mL of titanium tetraisopropoxide were added dropwise to a beaker containing 25 mL of a solvent such as isopropanol and 1.5 mL HCl, an the temperature of beaker was kept at 0°C using a water and ice bath. The mixture was stirred at 25°C for 48 h. The resulting sol was then sonicated for 30 min and then the solvent was removed over a hotplate with a rather slow stirring rate. The powder was calcined at the desired temperature and time. This simple was designated AC2/TiO2.
Textural characterization of activated carbons and the prepared catalysts
To determine the surface area and pore structure of activated carbon samples, the nitrogen adsorption–desorption isotherms at 77 K were measured by an automated adsorption instrument (IQ2 Quantachrome, Boynton Beach, FL, USA) with ± 0.15% accuracy. The surface area, pore volume and pore size distribution were determined from nitrogen adsorption data using Quantachrome software. Adsorption data were obtained over the relative pressure, P/Po, range from 10-5 to 1. The sample was degassed at 250°C under a vacuum for 4 h. The apparent surface area of nitrogen was calculated using the BET (Brunauer–Emmett–Teller) equation within the 0.01–0.3 relative pressure range. The micropore volume was determined according to the DR (Dubinin–Radushkevich) method31-34. The amount of N2 adsorbed at relative pressures near unity (≈0.99) corresponds to the total amount adsorbed in both micropores and mesopores; consequently, the subtraction of the micropore volume from the total amount will provide the volume of the mesopores. The pore size distribution was obtained by applying the density functional theory (DFT) method to the nitrogen adsorption isotherm using the software supplied by IQ231-32.
Catalyst characterization
X-ray powder diffraction (XRD)
XRD was performed using a Rigaku MiniFlex-II X-ray diffractometer with Cu Kα radiation (λ=0.15418 nm). The sample was scanned from 20° to 80° (2θ) at a rate of 0.02°/min. The phases present in the catalyst samples were identified using the Joint Committee on Powder Diffraction Standard (JCPDS) powder data files. The XRD pattern and data were also analyzed using the Powder X program35-39. From these XRD patterns, the crystallite or grain size (dXRD) of the prepared powders was estimated using the Scherrer equation (Eq.1) as follows10,33-35.
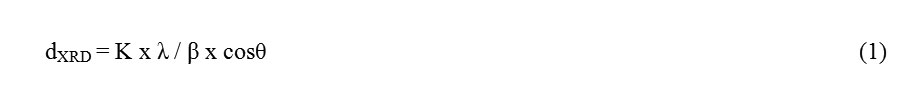
where λ, θ and β are the X-ray wavelength, Bragg diffraction angle and the full width at half-maximum (FWHM) of the diffraction peak, respectively. K is a constant normally equal to 0.94 and λ=0.1540 nm (the wavelength of emission of the device).
Transmission electron microscopy
TEM measurements were performed on a Philips G20 Ultra-Twin transmission electron microscope equipped with a CCD camera. Operating at 300 kV, the microscope can achieve a point resolution of 0.14 nm and a line resolution of 0.1 nm. Scale calibration was done on the Au (1 0 0) planes. Both dry and wet deposition were performed with ethanol and water as the solvents. Powders were deposited on carbon coated copper grids.
Photocatalytic activity measurements: reactor and test
Fig. 1 depicts the continuous flow system used for NOx degradation over AC1/TiO2 and AC2/TiO2. A round Pyrex glass vessel (φ × H, 15 cm × 4 cm) was used as the photoreactor to assess the degradation of NOx, and a sample dish (φ 7 cm) was located inside the vessel containing the nanoparticles of TiO2 supported on AC. A black lamp provided a UV light source with an intensity of 1 mW/cm2 (Sankyo Denki FL 20SBLB, main peak located at 352 nm). NOx degradation was carried out at room temperature using an air stream containing 1.0 ppm NO as the feedstock. Two mass flow controllers (MFCs) (type MFC-CB control box, Fluka, USA) manipulated the relative humidity (RH = 50%) in the feeding stream. The reaction gas in the feeding stream passed through a vessel containing TiO2 supported on AC (0.2 g) at a flow rate of 1 L/min. The measurements of NO and NOx concentrations were performed using an on-line chemiluminescence analyzer (AC32M, Environnement SA, France) with a detection limit of 0.4 ppb and a continuous sampling rate of 0.7 L/min. NO and NOx concentrations were measured in successive 5-s steps. The NO2 concentration was obtained from the difference between the NOx and NO concentrations12,36.
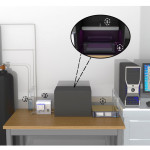 |
Fig. 1: Schematic diagram of the continuous flow reaction system for the photocatalytic degradation of NO: 1. Mass flow controler 2.Tramp 3.Peristaltic pump 4. Chemiluminescence equipment 5. UV source 6.Reactor 7. Computer Click here to View Figure |
RESULTS
Specific surface area and pore structural characterization analysis of the activated carbon
The N2 adsorption isotherms at 77 K of both the untreated sample (AC without titanium oxide) and samples coated with titanium oxide are shown in Fig. 2. The adsorption isotherms of the activated carbons exhibited a hybrid I/IV isotherm according to the IUPAC classification, which is characteristic of microporous materials with an important contribution of mesoporosity37. The N2 adsorption isotherms also showed a hysteresis loop (type H4) at relative pressures about 0.5 where the adsorption and desorption branches were parallel; this indicates the presence of small slit-shaped pores and well-developed mesoporosity for all the catalysts37. Isotherm data were analyzed for BET area, total pore volume, micropore volume and average pore width. Specific surface areas were calculated according to the BET method. Total pore volumes were directly derived from the adsorbed quantity at high relative pressures (P/Po 0.95, where Po is the saturation pressure of nitrogen at 77.36 K and equals 101.38 kPa). The results obtained from the nitrogen isotherms are presented in Table 1. Adsorption data were analyzed by the NLDFT equilibrium model for slit pores and the pore size distributions (PSD) were calculated38. The PSD, i.e. the distribution of pore volume with respect to pore size, is represented by the derivative of dV/dr as a function of r, where V is the pore volume and r is the pore radius. In the case of carbons, in which the pores are considered to be mostly slit-shaped, pore width (w) can replace pore radius (r), and the PSD can be presented similarly by the derivative of dV/dw as a function of w (results not shown).
When the AC was coated with titanium oxide using the CVD and sol-gel methods, the porous structure was modified. This change in the textural structure was most noticeable in the AC2/TiO2 sample. This can be explained considering that, in this catalyst, particles may plug some of the pores, whereas the AC covered using the CVD method had a greater number of particles in the pores because a TiO2 vapor was generated. This type of change was observed in the values of the apparent BET area and PSD. These results are consistent, and it was found that the pore size was smaller for AC2/TiO2, as suggested in the previous paragraph.
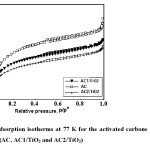 |
Fig. 2: N2 adsorption isotherms at 77 K for the activated carbons prepared from orange peel (AC, AC1/TiO2 and AC2/TiO2) Click here to View Figure |
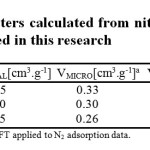 |
Table 1: Structural parameters calculated from nitrogen adsorption isotherms at 77 K for the samples prepared in this research Click here to View table |
XRD analysis
The materials were analyzed by XRD and the results are shown in Fig. 3. The diffraction patterns of pure TiO2, AC alone, AC1/TiO2, and AC2/TiO2 are presented for comparison. The two broad peaks of the AC prepared from orange peel sample indicate that the content of the well-ordered crystalline phase can be neglected. The peak from 20° to 30° 2θ corresponds to reflexes in the (002) plane, whereas the peak from 40° to 48° 2θ corresponds to the (100) plane39-42. The pattern exhibits broad peaks and the absence of a sharp peak indicating a predominantly amorphous structure, which is a typical characteristic of AC. This also indicates an advantageous property for well-defined adsorbents.
The photocatalysts were dominated mainly by the anatase phase. The main diffraction peaks at 25.3°, 37.8°, 48°, 53.9°, 55° and 62.5° 2θ were assigned to the diffraction planes of (1 0 1), (0 0 4), (2 0 0), (1 0 5), (2 1 1) and (2 0 4) for anatase (JCPDS # 021-1272), respectively. Other crystal phases corresponding to peaks at 27.4 and 36.1° 2θ were assigned the diffraction peaks of (1 1 0) and (1 0 1) of the rutile phase (JCPDS # 021-1276), respectively. The XRD patterns revealed the diffraction peaks of a mixture of the anatase and rutile phases, which is favorable for photocatalytic reactions43-49. XRD also showed that the AC prepared in this study did not affect the crystal structure of TiO2 when it was deposited on AC by the CVD method, but the peak intensity was lower and the peaks were wider, while the peaks in the AC2/TiO2 samples decreased and some cases were barely visible. This clearly shows the influence of the method used to coat AC with titanium oxide. Data analysis of the XRD patterns was performed using the PowderX program. The crystallite or grain size (dXRD) was determined using the Scherrer formula. The anatase (compound principal registered) crystallite sizes of AC1/TiO2 and AC2/TiO2 were 3.4 and 4.5 nm, respectively. The diffraction peak width increased with increasing BET surface area and pore volume, as shown above. Therefore, the crystal size of TiO2 decreased according to Eq. (1). This is in agreement with the literature on nanostructured powders with high purity44-49. The method used to coat AC with TiO2 may be responsible for this reduction in crystallite size, because the formation of TiO2 in the CVD method, which is performed in the vapor phase, allows free particles to enter the pores of AC, while the sol-gel method produces small agglomerations of particles with a slightly larger size. This suggests that AC could enhance the photocatalytic activity of NOx and would be presented in composited samples in this case with TiO2. Furthermore, in additional calculations, the anatase content (f(A)) was determined from the integrated intensity of the anatase diffraction line (1 0 1), IA, and that of the rutile diffraction line (1 1 0), IR, using the following equation (Eq. 2)46.
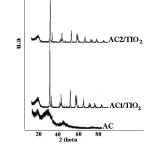 |
Fig. 3: XRD patterns of the prepared samples Click here to View Figure |

The anatase content of AC1/TiO2 and AC2/TiO2 was 0.977 and 0.898, respectively. The f(A) values show that the phases of the obtained catalysts were mainly anatase with a small amount of rutile.
TEM analysis
Fig. 4 shows TEM images of the AC1/TiO2 and AC2/TiO2 samples. The samples clearly present a microstructure consisting of TiO2 nanoparticles (≈3 nm) homogeneously dispersed on AC, especially in the case of AC1/TiO2. After coating, the titanium oxide nanoparticles remain homogeneously dispersed around the porous structure of AC (Fig. 4a).
The AC1/TiO2 sample (Fig. 4a) showed TiO2 nanoparticles embedded on a mass of AC obtained from orange peel. The image indicates that there were effective interactions between the oxide and the chemical groups on the carbon, as result of the more efficient CVD preparation method developed in this work. This corroborates the XRD results, which indicated that TiO2 particles penetrated the more porous structure of AC when the CVD method was used. Fig. 4b show a TEM image of the AC2/TiO2 sample, with accumulation of quite visible particles, unlike those obtained by the CVD method.
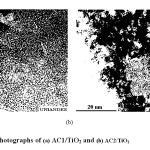 |
Fig. 4: TEM photographs of (a) AC1/TiO2 and (b) AC2/TiO2 Click here to View Figure |
NOx degradation results
Before starting the photocatalytic experiment, we performed several preliminary studies to optimize several variables such gas flow, temperature and other variables for the catalytic test of the photoactivity of the AC1/TiO2 and AC2/TiO2 systems in the NOx degradation reaction, as described in the Experimental section. The NO and NO2 concentrations were monitored continuously, and a profile of the concentrations as a function time was recorded (see Fig. 5 for a representative plot). As expected, the pure AC pure was catalytically inactive in the reaction, while the AC1/TiO2 and AC2/TiO2 catalysts were active under our experimental conditions and showed good conversion values. As shown in Fig. 5, the NO concentration reached a minimum value followed by a slow and continuous deactivation process after the adsorption of NO3– on the catalytic active sites.
Simple adsorption and desorption of NO gas (not due to photocatalysis) by the catalysts (AC1/TiO2 and AC2/TiO2) occurred in the dark (Fig. 5(a) and (b)). The net removal of NO gas at the beginning of illumination for AC1/TiO2 was higher in comparison to AC2/TiO2 The results show that the conversion values were associated with the TiO2 coating method, since the catalytic activity of AC1/TiO2 was greater than that of AC2/TiO2; this was associated with the findings described earlier. The sample obtained by the CVD method had higher catalytic activity, which shows that the deposited vapor phase TiO2 was more efficient than TiO2 deposition by the sol-gel method where the pores of the AC were blocked. The CVD method allows for the uniform deposition of TiO2nanoparticles within the porous structure, which generates a more active sample. Fig. 5 shows the typical evolution of the NO, NOx and NO2 concentrations during a test intended to assess the photocatalytic efficiency of the coating. The degradation of nitrogen oxides by photocatalysis led to the oxidation of NO to NO2, which, in turn, produced nitrite and nitrate ions (reaction (4)).
The mechanism of the photocatalytic reaction using supported nanoparticles of titanium, in this case AC prepared from orange peel, has been studied by several authors and is published in the literature50,51. Several studies agree on a number of steps that we reproduced in our research, considering that these reactions are very consistent with what we have established in this investigation. Thus, we believe that the photocatalytic process occurs in three main steps: (1) mass transport and adsorption of pollutants from the bulk air to the surface of the catalyst; (2) photocatalytic reaction on the catalyst; (3) desorption and mass transport of the reaction products from the surface of the catalyst to the air. The photocatalytic oxidation mechanism has been investigated extensively51-55. Based on previous publications50,51 and the results of the present study, we believe that Eqs. (3)–(12) represent the photocatalytic reaction mechanism of NO. Eq. (3) shows the photon-mediated generation of electron/hole pairs50-52.
Formula 3 To 6
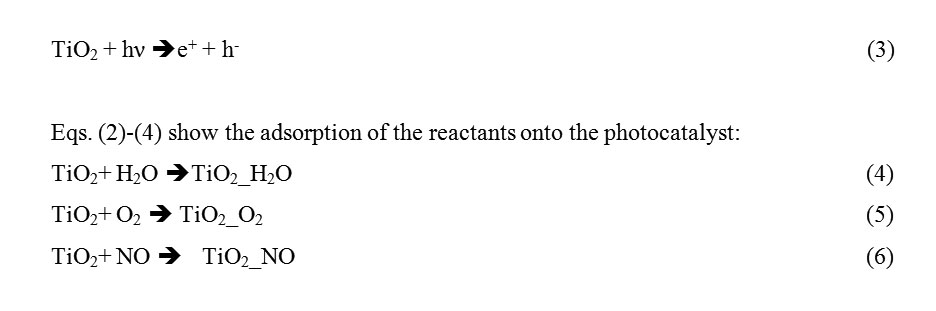
Eq.(5) shows the recombination of the generated electron and hole pairs
Formula7, To 12
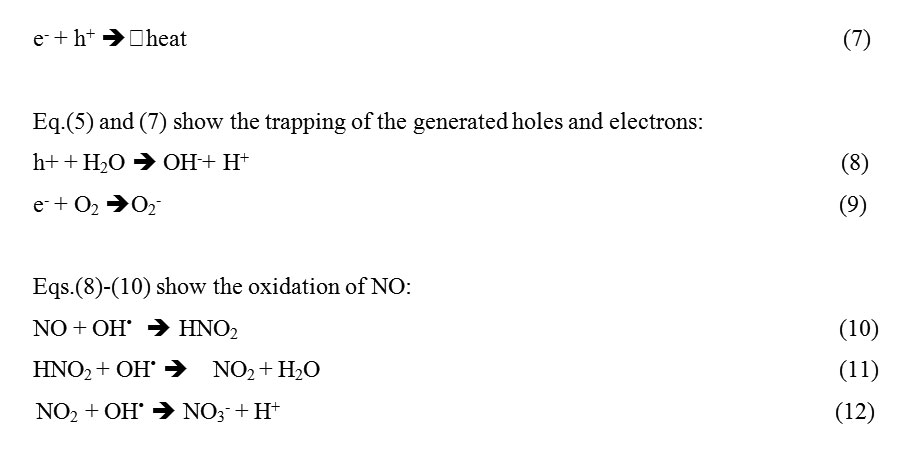
These reactions clearly show the role of adsorbed oxygen and water and its very important role in the heterogeneous photocatalytic oxidation reaction. Oxygen is used to trap the generated electrons on the TiO2 surface coating on AC. Hydroxyl radicals are produced from water by trapping the generated holes on the TiO2 surface, which then leads to the oxidation of NO2 and finally NO3–. In another series of studies reported in the literature, these reactions clearly show the role of oxygen and water56. The photocatalytic oxidation reaction takes place immediately when the sample is exposed to the visible light. The NO2 concentration increases and quickly reaches a stable condition. After reaching the maximum degradation rate, the process will slightly slow down and reach a stable conversion condition. Fig. 3 shows the concentration change in NOx during the photocatalytic oxidation reaction. The photocatalytic oxidation of NO is calculated from Eq. (13)
Rormula, 13

where [CNO]out is defined as the average NO concentration of the last 5 min in the measurement time. Eq. (11) shows the formation of NO2 during the oxidation reaction. However, not all the produced NO2 can be oxidized to HNO3 because a small part of it is released into the air due to desorption. So, the exit pollutant is composed of the remaining NO and the undesired intermediate NO2. The amount of NOx removed is calculated using Eq. (14)
Formula 14

where [CNOx]out is defined as the average NOx concentration at the exit port in the last 5 min of the measurement time.
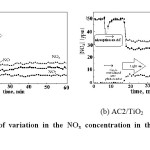 |
Fig. 5: Profiles of variation in the NOx concentration in the reactor during a typical test Click here to View Figure |
CONCLUSIONS
In this study, two catalysts (AC1/TiO2 and AC2/TiO2) were prepared using AC derived from orange peel by two different methods to achieve the deposition of titanium oxide nanoparticles (CVD and sol-gel). The results show the superiority of the AC1/TiO2 catalyst, prepared using the CVD method to apply TiO2 nanoparticles onto the surface of the AC, because this method allows vaporized nanoparticles to enter into the porous structure. The XRD results show that the nanoparticles were a mixture of the anatase and rutile phases, which makes the catalyst more efficient regarding NOx degradation. NOx degradation assays were used to test catalyst efficiency.
ACKNOWLEDGMENTS
The authors wish to thank the framework agreement between the Universidad Nacional de Colombia and the Universidad de los Andes (Colombia) under which this research was carried out. Additionally, the authors thank the Faculty of Sciences and the Vice-Rector of Research of the Universidad de los Andes (Bogotá, Colombia) for funding this research.
REFERENCES
- Ao C.H., Lee S.C., Mak C.L., Chan L.Y., Photodegradation of volatile organic compounds (VOCs) and NO for indoor air purification using TiO2: promotion versus inhibition effect of NO, Appl. Catal. B, 42;119-129 (2003).
- Haywood J.M., Cooper C.D., The economic feasibility of using hydrogen peroxide for the enhanced oxidation and removal of nitrogen oxides from coal-fired power plant flue gases, J. Air Waste Manage. Assoc. 48; 238–246 (1998).
- Adewuyi Y.G., Owusu S.O., Aqueous absorption and oxidation of nitric oxide with oxone for the treatment of tail gases: process feasibility, stoichiometry, reaction pathways, and absorption rate, Ind. Eng. Chem. Res. 42: 4084–4100 (2003).
- Farrell A, Multi-lateral emission trading: lessons from inter-state NOx control in the United States, Energy Policy, 29; 1061–1072 (2001).
- Jeong 1061–1072, Sekiguchi K, Saito M, Lee Y, Kim Y, Sakamoto K, Removal of gaseous pollutants with a UV-C254+185 nm/TiO2 irradiation system coupled with an air washer, Chem. Eng. J. 118; 127–130 (2006).
- Castro T, Madronich S, Rivale S, Muhlia A, Mar B., The influence of aerosols on photochemical smog in Mexico City, Atmos. Environ. 35; 1765–1772 (2001).
- Mok Y.S., Absorption-reduction technique assisted by ozone injection and sodium sulfide for NOx removal from exhaust gas, Chem. Eng. J. 118; 63–67 (2006).
- Zamansky V.M., Ho L., Maly P.M., Seeker W.R., Oxidation of NO to NO2 by hydrogen peroxide and its mixtures with methanol in natural gas and coal combustion gases, Combust. Sci. Technol. 120; 255–272 (1996).
- Ibusuki T., Takeuchi K., Removal of low concentration of nitrogen oxides through photoassisted heterogeneous catalysis, J. Mol. Catal. 88; 93–102 (1994).
- Wu Z., Sheng Z., Liu Y., Mo H.W.J., Deactivation mechanism of PtOx/TiO2 photocatalyst towards the oxidation of NO in gas phase, Journal of Hazardous Materials 185; 1053–1058 (2011).
- Monge M.e., D´Anna B., George C., Nitrogen dioxide removal and nitrous acid formation on titanium oxide surfaces—an air quality remediation process, Physical Chemistry Chemical Physics, 12 (31); 8991-8998 (2010).
- Ballari M.M., Hunger M., Husken G., Brouwers H.J.H., NOx photocatalytic degradation employing concrete pavement containing titanium dioxide, Applied Catalysis B: Environmental 95; 245–254 (2010).
- Puma G.L, Bono A., Krishnaiah D., Collin J.G., Preparation of titanium dioxide photocatalyst loaded onto activated carbon support using chemical vapor deposition: A review paper, Journal of Hazardous Materials 157; 209–219 (2008).
- Matos J, Laine J, Hermann J., Synergy effect in the photocatalytic degradation of phenol on a suspended mixture of titania and activated carbon, Appl. Catal. B: Environ. 18 (3–4); 281–291 (1998).
- Herrmann J, Matos J., Disdier J, Guillard C., Laine J., Malato S., Blanco J., Solar photocatalytic degradation of 4-chlorophenol using the synergistic effect between titania and activated carbon in aqueous suspension, Catal. Today 54 (2-3); 255–265 (1999).
- Hu Z., Vansant E.F., Synthesis and characterization of a controlled micropore-size carbonaceous adsorbent produced from walnut shell, Microporous Mater. 3(6); 603–612 (1995).
- Arriagada R., Garcia R., Molina-Sabio M., Rodriguez-Reinoso F., Effect of steam activation on the porosity and chemical nature of activated carbons from Eucalyptus globulus and peach stones, Microporous Mater. 8(3–4); 123-130 (1997).
- Arana J., Dona-Rodriguez J.M., Rendon E.T., Cabo C.G., Gonzalez-Diaz O., Herrera-Melian J.A., Perez-Peña J., Colon G., Navio J.A., TiO2 activation by using activated carbon as a support. Part 1: Surface characterization and decantability study, Appl. Catal. B 44(2); 161–172 (2003).
- Moreno-Piraján J.C., Giraldo L., Heavy Metal Ions Adsorption from Wastewater Using Activated Carbon from Orange Peel, E-Journal of Chemistry, 9(2); 926-937 (2012).
- Keith K.H, McKay G., Study of arsenic (V) adsorption on bone char from aqueous solution,J. Hazard. Mater., 160; 845-854 (2008).
- Purevsuren B, Avid B, Narangerel J, Gerelmaa T and Davaajav Y, Investigation on the pyrolysis products from animal bone, J Mater Sci., 9(2); 737-740 (2004).
- Hsisheng T., Hsieh C.T., Influence of surface characteristics on liquid-phase adsorption of phenol by activated carbons prepared from bituminous coal, Ind Eng Chem Res., 37(9); 3618-3624 (1998).
- Suárez-García F., Martínez-Alonso A., Tascón J.M.D., Porous texture of activated carbons prepared by phosphoric acid activation of apple pulp, Carbon, 39; 1111-1115 (2001).
- Molina-Sabio M., Rodríguez-Reinoso F., Caturla F., Sellés J M, Porosity in granular carbons activated with phosphoric acid, Carbon, 33; 1105-1113(1995).
- Baquero M.C, Giraldo L., Moreno J.C, Suárez-García F., Martínez-Alonso A., Tascón J.M.D, Activated carbons by pyrolysis of coffee bean husks in presence of phosphoric acid, J Therm Anal Appl Pyrol., 70; 779-784 (2003).
- Moreno-Piraján J.C., Giraldo L., Study of activated carbons by pyrolysis of cassava peel in the presence of chloride zinc, J Anal Appl Pyrol., 87(2), 288-290 (2010).
- Moreno-Piraján J.C., Giraldo L., Adsorption of copper from aqueous solution by activated carbons obtained by pyrolysis of cassava peel, J Anal Appl Pyrol., 87(2), 188-193 (2010).
- Ding Z., Hu X., Yue P., Lu G., Greenfield P., Synthesis of anatase TiO2 supported on porous solids by chemical vapor deposition, Catalysis Today 68; 173-182 (2001).
- Amjad H., El-Sheikh A.P., Newman, Hafid A.D., Suki P., Neil C., Steven Y., Deposition of anatase on the surface of activated carbon, Surface & Coatings Technology 187; 284– 292 (2004).
- Slimena H., Houasa A., Nogierb J.P, Elaboration of stable anatase TiO2 through activated carbon addition with high photocatalytic activity under visible light, Journal of Photochemistry and Photobiology A: Chemistry 221; 13–21 (2011).
- 31. Stoeckli F., Centeno T.A., Donnet J.B., Pusset N., Papirer E., Characterization of industrial activated carbons by adsorption and immersion techniques and by STM. Fuel, 74; 1582-88 (1995).
- Nakagawa Y., Molina-Sabio M., Rodríguez-Reinoso F., Modification of the porous structure along the preparation of activated carbon monoliths with H3PO4 and ZnCl2. Micropor. Mesopor. Mat, 103; 29-34 (2007).
- Yorgun S., Vural N., Demiral H., Preparation of high-surface area activated carbon from Paulownia by ZnCl2 activation. Micropor. Mesopor. Mater, 122; 189–194 (2009).
- Vargas-Delgadillo D., Giraldo L., Moreno-Piraján J.C., Preparation and characterization of activated carbon monoliths with potential application as phenol adsorbents. E.J. Chem. 7; 531-539 (2010).
- Hirano M., Nakahara C., Ota K., Tanaike O., Inagaki M., Photoactivity and phase stability of ZrO2-doped anatase-type TiO2 directly formed as nanometer-sized particles by hydrolysis under hydrothermal conditions, J. Solid State Chem. 170; 39–47 (2003).
- Dalton J.S., Janes P.A., Jones N.G., Nicholson J.A., Hallam K.R., Allen G.C., Photocatalytic oxidation of NOx gases using TiO2: a surface spectroscopic approach, Environmental Pollution 120; 415–422 (2002).
- Sing K.S.W., Everett D.H., Haul R.A.W., Moscou L., Pierotti R.A., Rouquerol J., Siemieniewska T., Pure and Applied Chemistry 57; 603–619 (1985).
- Landers J., Gor G.Y., Neimark A.V., Density functional theory methods for characterization of porous materials, Colloids and Surfaces A: Physicochem. Eng. Aspects 437; 3-32 (2013).
- Linh L.L.T, Chin S., Ju J., Anh H., Photocatalytic degradation of methylene blue by a combination of TiO2-anatase and coconut shell activated carbon, Powder Technology 225; 167–175 (2012).
- Yoon K.H, Noh J.S., J., Kwon C.H., Muhammed, M. Photocatalytic behaviour of TiO2 thin film prepared by sol-gel process. Materials Chemistry and Physics 95; 79-83 (2006).
- Kumar K., Saxena R.K., Kothari R.D., Suri K., Kaushik N.K., Bohra J.N., Correlation between adsorption and x-ray diffraction studies on viscose rayon based activated carbon cloth, Carbon 35 (12) 1842–1844 (1997).
- Hashemian S., Zahra, K., Yazdi A., Preparation of activated carbon from agricultural wastes (almond Shell and orange peel) for adsorption of 2-pic from aqueous solution, Journal of Industrial and Engineering Chemistry, in press (2013)
- Vasilyeva E., Tolochko O., Kim B., Lee D., Kim D., Synthesis of tungsten disulphide nanoparticles by the chemical vapor condensation method, Microelectronics Journal 40; 687–691 (2009).
- Kim J., Kim B., Synthesis of nanosized tungsten carbide powder by the chemical vapor condensation process, Scripta Materialia 50; 969–972 (2004).
- Wang Z., Choi C., KimJ., Kim B., Zhang Z., Characterization of Fe–Co alloyed nanoparticles synthesized by chemical vapor condensation, Materials Letters 57; 3560–3564 (2003).
- Toyoda M., Nanbu Y., Nakazawa Y., Hirano M., Inagaki M., Effect of crystallinity of anatase on photoactivity for methyleneblue decomposition in water, Applied Catalysis B: Environmental 49; 227–232 (2004).
- Arbuj S.S., Hawaldar R.R., Mulik U.P., Wani B.N., Amalnerkar D.P., Waghmode S.B., Preparation, characterization and photocatalytic activity of TiO2 towards methylene blue degradation, Materials Science and Engineering B 168; 90–94 (2010).
- Spurr R.A., Myers H., Quantitative analysis of anatase–rutile mixtures with an X-ray diffractometer, Analytical Chemistry 29; 760–762 (1957).
- Mädler L., Stark W.J., Pratsinis S.E., Flame-made ceria nanoparticles, Journal of Materials Research 16; 1356–1362 (2002).
- Yu Q.L., Brouwers, H.J.H., Indoor air purification using heterogeneous photocatalytic oxidation. Part I: Experimental study Applied Catalysis B: Environmental 92; 454–461 (2009).
- Staub de Melo, J.V.,Trichês, G., Evaluation of the influence of environmental conditions on the efficiency of photocatalytic coatings in the degradation of nitrogen oxides (NOx), Building and Environment 49: 117-123 (2012).
- Devahasdin, S., C.Fan, Li, J.K., Chen,D.H., Photocatalytic oxidation of nitric oxide: transient behaviour and reaction kinetics. J. Photochem. Photobiol. A: Chem. 156; 161–170 (2003).
- Wang,H., Wu, Z., Zhao,W., Guan,B., Photocatalytic oxidation of nitrogen oxides using TiO2 loading on woven glass fabric. Chemosphere 66; 185–190 (2007).
- Zhang, J., Hu, Y., Matsuoka, M., Yamashita, H., Minagawa, M., Hidaka, H., Anpo, M.: Relationship between the local structures of titanium oxide photocatalysts and their reactivities in the decomposition of NO. J. Phys. Chem. B 105; 8395–8398 (2001).
- Turchi, C.S., Ollis, D.F., Photocatalytic degradation of organic-water contaminats mechanisms involing hydroxyl radical attack, J. Catal. 122; 178–192 (1990).
- Lim, T.H., Jeong, S.M., Kim, S.D., Gyenis, J., Photocatalytic decomposition of NO by TiO2 particles, J. Photochem. Photobiol. A: Chem. 134 (2000) 209–217.

This work is licensed under a Creative Commons Attribution 4.0 International License.
![]()
A New Edition of Web of Science
Journal Impact Factor
2022: 0.5
Five Year: 0.8
Journal is Indexed in

Cabells Whitelist
![]()


