A Survey of the Effect of Some Heavy Metals in Plant on the Composition Of The Essential Oils Close to Veshnaveh-Qom Mining Area
Mohammad Hadi Givianrad*and Azam Hashemi
Department of Chemistry, College of Basic Science, Tehran Science and Research Branch, Islamic Azad University, Tehran, Iran
DOI : http://dx.doi.org/10.13005/ojc/300246
Article Received on :
Article Accepted on :
Article Published : 28 Jun 2014
The purpose of this study was to evaluate the effect of copper and silver in the plants on the mining area and the ingredients of essential oils. Plants collected from the same family, but they were collected randomly from various regions. The concentration of heavy metal in plant samples collected from Veshnave, Qom, Iran have been determined by Flame Atomic Absorption Spectrometry (FAAS). The chemical composition of essential oil isolated by hydrodistillation from Tanacetum polycephalum and was determined using Gas Chromatography/Mass Spectrometry (GC- MS). Results obtained from unidirectional variance analysis suggest that there is a meaningful statistical difference between various regions.
KEYWORDS:FAAS; Microwave; Copper; Silver; GC- MS; Tanacetum polycephalum
Download this article as:| Copy the following to cite this article: Givianrad M. H, Hashemi A. A Survey of the Effect of Some Heavy Metals in Plant on the Composition Of The Essential Oils Close to Veshnaveh-Qom Mining Area. Orient J Chem 2014;30(2). |
| Copy the following to cite this URL: Givianrad M. H, Hashemi A. A Survey of the Effect of Some Heavy Metals in Plant on the Composition Of The Essential Oils Close to Veshnaveh-Qom Mining Area. Orient J Chem 2014;30(2). Available from: http://www.orientjchem.org/?p=4078 |
INTRODUCTION
The plants for growing need relatively low amount of mental ions. Natural soil consists of great amount of metal elements. Despite the selective absorption in root cellular membrane, it is possible a few metal ions are found in plant tissues ¹. Heavy metals are important environmental pollutants and they will be toxic as the result of human activities in natural and agricultural areas. The reason of toxicity of heavy metals in higher concentration is that they disturb some vital factors of body. Some metals are found naturally in the body and are essential for health. Naturally, low-concentration heavy metals are found and they are considered low-quantity metals. They are toxic in high concentration or lead to inefficiency and defect in other low-quantity metals ³. In high concentration of metals, substitution with essential metals is occurred and as essential metals play important role in formation of pigments and enzymes, the pigments are disrupted and existing elements in soil will be unsuitable for plant growth and biological variety is eliminated 13,14.Heavy metals have no role in the body as a metal and they may be extremely toxic4.
Copper has roles in proteins structure, photosynthesis electrons transport, mitochondrial respiration, oxidative tension, cell wall metabolism. Copper (Cu) is a cofactor in enzymes as copper/zinc superoxide, cytochrome-c oxidize, amino oxidize, lactase, plastocyanin, and polyphenol oxidize. Copper is effective in movement of iron in cells¹. The plants need copper as a micronutrient matter for growth. Silver soluble salts namely silver nitrate is toxic in concentration above two grams. Silver compounds could be absorbed easily by body tissues and blue or black pigments are created in the skin. One of the suitable methods to measure metals in various materials is using FAAS technique15. The present study applied this method to measure heavy metals in plant tissue. Determining low quantities of metals in plants was accomplished by digestion with acid or mixture of acids by microwave. The elements were measured by suitable apparatus techniques 6. Microwave digestion technique is used for multiple samples and short digestion time7,8,9.
EXPERIMENTAL
Reagent and Standard
All reagents were of analytical grade. Double deionized water was used for all dilution. Nitric acid (HNO3) with purity 65%, H2O2 with purity 30% were of pure quality (Merck, Germany). Cu (1.0–5.0 mg/L) and Ag (0.5–5.0 mg/L) were prepared by dilutions from stock solutions of 100 mg/L.
Collection of plants
Plants used in the research from close, 5 and 10 Km around the Veshnave Mine, Qom, Iran in May 2012. Plants were of family Corpositae, a genus Tanacetum polycephalum. After the plants were collected, dried and powdered, it was homogeneous10.
Essential oil extraction
The dried parts from Tanacetum polycephalum were subjected to hydrodistillation for 3 hours. The essential oil obtained was separated from water with 0.5 ml hexan normal. To analyze the essence, GC-MS is used.
Gas Chromatography – Mass Spectrometry (GC-MS)
GC-MS analysis was performed by Hewlett-Packard equipped with a HP-5MS column (30m × 0.25 mm, film thickness 0.32 mm). Helium used as the carrier gas (1 ml/min). The oven temperature increased from 60°C to 220°C at a rate of 6°C/min.
Identification of components
Retention indices (RI) were calculated by using retention times of n-alkanes (C6–C24) that were injected after the oil at the same temperature and conditions. The compounds were identified by comparing their RI with those reported in the literature, and their mass spectrum was compared with those reported in Wiley Library 17.
Sample digestion and analysis
To digest the plant samples, microwave is used. 7 mL of HNO3 (65% v/v) and 1 ml hydrogen peroxide (30% v/v) were added to 0.5 g dry weight (DW) of tissue and digestion was performed. The extract was filtered and diluted to 25 ml. The metals (Cu and Ag) in the surface water and the plant extracts were analyzed by FAAS (Varian-spectraAA-240)7,11.
RESULT AND DISCUSSION
The solutions after digestion are used for analysis of copper and silver. The samples (n=9) were collected in particular, from three different areas. Mean values and standard deviations of Cu and Ag in different areas were tabulated in Table 2.
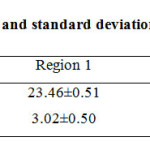 |
Table 1: Mean values and standard deviations of metals in plant Click here to View table |
Each value in this table shows the metal concentration in dry plants. Region 1 is in the mine, region 2 is 5km from the mine and region 3 10km from the mine.
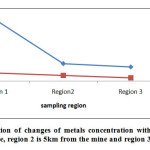 |
Fig1: The investigation of changes of metals concentration with distance from mine. *Region 1 is in the mine, region 2 is 5km from the mine and region 3 10km from the mine Click here to View Figure |
RSD of method for 9 successive measurement of copper was achieved 0.36 % and for silver as 1.13%. LOD for copper is 0.01% and for silver 0.025% and R for copper is ranging 90.15% to 103.9% and ranging 93% to 106% for silver. According to the chart observed this plant susceptible to absorb Cu more than Ag.
Essence analysis by GC-MS
The chemical composition of each oil was tabulated in table 2.
Table 2: The identified compositions in essence of different regions
|
Composition In region 3(%) |
Composition in region 2(%) |
Composition in region 1(%) |
KI* |
Compound |
|
6.27 |
5.54 |
3.85 |
934 |
α-pinene |
|
2.76 |
3.35 |
3.51 |
950 |
Camphene |
|
2.81 |
2.76 |
1.74 |
973 |
Sabinene |
|
1.86 |
1.83 |
1.13 |
978 |
β-pinene |
|
12.89 |
11.89 |
9.06 |
1033 |
1.8 cineole (Eucalyptol) |
|
2.43 |
2.43 |
2.41 |
1069 |
Gamma-pinene |
|
2.34 |
4.29 |
1.74 |
1142 |
Chrysanthenone |
|
23.21 |
25.07 |
27.18 |
1172 |
Camphor |
|
0.00 |
0.00 |
4.79 |
1178 |
Benzenepropanal |
|
18.39 |
14.81 |
8.24 |
1190 |
Borneol |
|
4.27 |
4.30 |
4.18 |
1197 |
4 Terpineol |
|
1.67 |
2.83 |
2.99 |
1208 |
Alpha terpineol |
|
0.00 |
2.89 |
11.68 |
1296 |
Cinnamic aldeyhid |
|
11.30 |
3.13 |
6.32 |
1305 |
Bornyl acetate |
|
1.24 |
9.92 |
4.86 |
1364 |
Alpha–terpinyl acetate |
|
3.47 |
1.63 |
1.11 |
1515 |
Germacrene |
|
2.31 |
1.37 |
2.38 |
1618 |
Spathulenol |
|
3.36 |
0.00 |
0.37 |
1645 |
Farnezol |
Each value in this table shows compositions in essence in dry plants. * KI: Kovats Index, **region 1, is in the mine, region 2, is 5km from the mine and region 3, 10km from the mine. 18 compounds were characterized in the oil in region 1 close to mine with camphor (27.18%), cinnamic aldeyhid (11.68%), 1,8-cineole (9.06%) and borneol (8.24%) as main compounds. 16 compounds were characterized in the oil in region 2 near the mine (5km) with camphor (25.07%), borneol (14.81%) and 1,8-cineole (11.89%) as main compounds. camphor (23.21%), borneol (18.39%), 1,8-cineole (12.89%) and bornyl acetate (11.30%) were the major compounds in the region 3 from high distance from mine. The identified compounds in this study are two types of monoterpens and sesquiterpenes. The structure of Monoterpens and Sesquiterpens compounds is divided into hydrocarbon and oxygenated compounds (Table 3).
Table 3: Identified terpens in various regions essence
|
Compound in region 1 (%) |
Compound in region 2 (%) |
Compound in region 3 (%) |
|
|
MH |
12.64 |
15.91 |
16.13 |
|
OM |
53.39 |
63.19 |
63.77 |
|
SH |
1.11 |
1.63 |
2.31 |
|
OS |
2.75 |
3.79 |
6.86 |
Each value in this table shows terpens in essential oil, * MH: Monoterpene Hydrocarbon;OM: Oxygenated Monoterpene; SH: Sesquiterpene Hydrocarbon; OS: Oxygenated sesquiterpene. **Region 1 is in the mine, region 2 is 5km from the mine and region 3 10km from the mine.
Comparison of mean concentration of zinc in different regions
Table 4: Comparison of mean concentrations (Zn, MH, OM and SH) in different regions using unidirectional variance analysis and Duncan’s test results
|
Region 1 |
Region 2 |
Region 3 |
F |
P |
|
|
mg/L copper |
23.46±0.51 |
6.72±0.61 |
5.42±0.55 |
3025.3 |
0.001< |
|
mg/L silver |
3.02±0.50 |
2.08±0.52 |
1.18±0.52 |
171.3 |
0.001< |
|
MH (%) |
12.64±0.86 |
15.91±1.01 |
16.13±1.12 |
954.2 |
0.001< |
|
OM (%) |
53.39±0.54 |
63.19±0.89 |
63.77±0.85 |
1662.5 |
0.001< |
|
SH (%) |
1.11±0.78 |
1.63±0.57 |
2.31±0.51 |
237.5 |
0.001< |
|
OS (%) |
2.75±0.75 |
3.79±0.51 |
6.86±0.76 |
529.7 |
0.001< |
*Values ”Mean ± SD” is shown; **MH: Monoterpene Hydrocarbon;OM: Oxygenated Monoterpene; SH: Sesquiterpene Hydrocarbon; OS: Oxygenated sesquiterpene; ***region 1 is in the mine, region 2 is 5km from the mine and region 3 10km from the mine.
Mean values and standard deviations of Cu and Ag in different areas were tabulated in Table 5. The highest concentration of Cu and Ag was observed near the mine and the lowest value was observed at distances of 10 km from the mine. Our results indicate the significant differences between the mean values of Cu and Ag in the different regions (F(Cu) =3025.3; F(Ag) = 171.3; p<0.001); alternatively, by increasing distance from the mine, the concentration of Cu and Ag decreases. The results of Duncan test showed that the average of Cu and Ag concentration near the mining areas was significantly higher than 5 km and 10 km from the mine (p<0.05); moreover, mean Cu and Ag concentration was significantly higher in the 5 km area of mine than 10 Km area.
Comparison of mean concentration of metals on MH in different regions
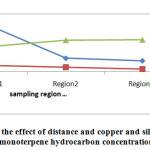 |
Fig2: The study of the effect of distance and copper and silver concentration on monoterpene hydrocarbon concentration |
The values of MH in different areas shown in Table 3. As shown in the charts, by increasing the copper and silver concentration, monoterpene hydrocarbon concentration is increased, too. Mean values and standard deviations of MH in different areas shown in Table 4. The highest concentration of MH was observed at distances of 10 km from the mine and the lowest value was observed near the mine. Our results indicate the significant differences between the mean values of MH in the different regions (F =954.2; p<0.001); on the other hand, by increasing distance from the mine, the concentration of MH would be increased. Duncan test results showed that the average of MH concentration near the mining areas was significantly lower than 5 km and 10 km from the mine (p<0.05).
Comparison of mean concentration of metals on OM in different regions
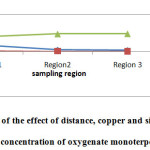 |
Fig3: Evaluation of the effect of distance, copper and silver concentration on concentration of oxygenate monoterpene |
The values of MO in different areas shown in Table 3. As shown in the charts, as by increasing the copper and silver concentration, oxygenated monoterpenes concentration is increased.Mean values and standard deviations of OM in different areas shown in Table4. The highest concentration of OM was observed at distances of 10 km from the mine and the lowest value was observed near the mine. Our results indicate the significant differences between the mean values of OM in the different regions (F =1662.5; p<0.001); on the other hand, by increasing distance from the mine, the concentration of OM would be increased. Duncan test results showed that the average of OM concentration near the mining areas was significantly lower than 5 km and 10 km from the mine (p<0.05).
Comparison of mean concentration of metals on SH in different regions
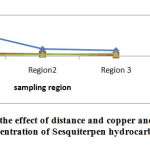 |
Fig4: The evaluation of the effect of distance and copper and silver concentration on concentration of Sesquiterpen hydrocarbon |
The values of SH in different areas shown in Table 3. As shown in the charts, as by increasing the copper and silver concentration, sesquiterpene hydrocarbons concentration is increased.Mean values and standard deviations of SH in different areas shown in Table 4. The highest concentration of SH was observed at distances of 10 km from the mine and the lowest value was observed near the mine. Our results indicate the significant differences between the mean values of MH in the different regions (F =237.5; p<0.001); on the other hand, by increasing distance from the mine, the concentration of SH would be increased. Duncan test results showed that the average of SH concentration near the mining areas was significantly lower than 5 km and 10 km from the mine (p<0.05).
Comparison of mean concentration of metals on SO in different regions
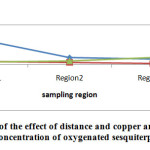 |
Fig5: The evaluation of the effect of distance and copper and silver concentration on concentration of oxygenated sesquiterpene |
The values of OS in different areas shown in Table 3. As shown in the charts, as by increasing the copper and silver concentration, oxygenated sesquiterpene concentration is increased.
Mean values and standard deviations of OS in different areas shown in Table 4. The highest concentration of OS was observed at distances of 10 km from the mine and the lowest value was observed near the mine. Our results indicate the significant differences between the mean values of OS in the different regions (F =529.7; p<0.001); on the other hand, by increasing distance from the mine, the concentration of OS would be increased. Duncan test results showed that the average of OS concentration near the mining areas was significantly lower than 5 km and 10 km from the mine (p<0.05).
Pearson’s correlation coefficient was used in order to investigate the relationship between studied variables, as tabulated in Table 5. There is a positive correlation between Cu and Ag (r=0.9020). The negative relationship between Cu, Ag and MH (rCu= -0.9999; rAg= -0.8983), OM (rCu= -0.9998; rAg= -0.8954), SH (rCu= -0.8598; rAg= -0. 9960) and OS (rCu= -0.9999; rAg= -0.8983) was besides observed.
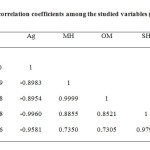 |
Table5: Pearson’s correlation coefficients among the studied variables (n=9) Click here to View table |
MH: Monoterpene hydrocarbon; OM: Oxygenated monoterpene;
SH: Sesquiterpene hydrocarbon; *Significant at P<0.05, **Significant at P<0.01, ***Significant at P<0.001
Copper concentration should be low in plants. Due to the Redox feature of copper, its high concentration is dangerous. The mean content of copper in plant tissue is 10 microgram/gram. Excess copper avoids plant growth and is involved in important cellular processes as photosynthesis and respiration. The plants growing in high copper concentration show reduction in biomass and chloratic signs. Low chlorophyll content and changes of chloroplast structure and composition of thylakoid membrane in leaf are found under such growth conditions, namely destruction of grana lamellae and stroma lamellae and the increase of size and number of plastoglobuli are observed.
Based on the adverse effects of copper and its important role, copper reduction, as in the structure of the identified compound in essence there is carbon-carbon double bond and carbon-oxygen double bond, copper reduces these bonds and changes their structure.
CONCLUSION
This study showed that by increasing the distance from the Veshnave-Qom mine, the concentration of Copper and Silver in Tanacetum polycephalum plant decreases. Besides, increase in copper and silver concentration in the above-mentioned plant leads to more increase in terpene compound, particularly oxygenated monoterpenes and oxygenated sesquiterpenes.
ACKNOWLEDGMENTS
The authors are so grateful to the Laboratory Complex of I.A.U. for valuable technical assistance.
REFERENCES
- Givianrad, M.H.; Sadeghi T.; Larijani, K.; Hosseini S.E.; Journal of food and technology and nutrition. 2011, 30, 38-44.
- Lari Yazdi; Haghir Cheregani, Sepasi; National Conference on New Ideas in agriculture. Islamic Azad University (Isfahan). 2010, 1, 20-24.
- Givianrad, M.H.; Amiri Khorheh N.; Larijani, K.; Chemistry of Natural Compounds. 2012, 48, 30-37.
- Givianrad, M.H.; Journal of Chemistry .2012, 9, 716-728.
- Ajasa; Al Moaruf Olukayode; Bello; Muibat Olabisi; Omotayo Ibrahim; Asiata. Ogunwande; Isiaka Ajani; Olawore; Nureni Olayide; Food chemistry, Elsevier. 2002, 85, 67–71.
- Du Laing, Gijs; M.G., Tack; Filip.G.; Verloo, Marc.; Analytica Chimica Acta, Elsevier. 2003, 497, 191–198.
- Aydin, Işıl; Microchemical Journal, Elsevier.2008, 90, 82–87.
- Margu´, E. Queralt, I. Carvalho, M.L. Hidalgo, M.; Analytica Chimica Acta, Elsevier, 2005, 549, 197–204.
- Niemelä, Matti; Perämäki, Paavo; Piispanen, Juha; Poikolainen, Jarmo; Analytica chimica acta, Elsevier.2004, 521,137–142.
- Neves, C.F.; Renato; Moraes, M. ; Paula, A.D.; Saleh, Mayra; Loureiro, R. ; Vanessa; Food Chemistry, Elsevier.2008, 113, 679–683.
- Sastre, J.; Sahuquillo, A.; Vidal, M.; Rauret, G.; Analytica Chimica Acta, Elsevier.2002, 462, 59–72.
- Polkowska-Motrenko, Halina; Danko, Bo_zena; Dybczy´nski, Rajmund; Koster-Ammerlaan Anneke; Bode, Peter; Analytica Chimica Acta, Elsevier. 1999, 408, 89–95.
- Givianrad, M.H.; Saffarpour, S.; Larijani, K.; Beheshti, P.; Chemistry of Natural Compounds. 2011, 3, 428-430.
- Givianrad, M.H.; Saffarpour, S.; Beheshti, P.; Chemistry of Natural Compounds. 2011, 47, 798-799.
- Ganjavi, M; Ezzatpanah, H.; Givianrad, M.H.; Shams A.; Food Chemistry. 2010, 3, 525-528.
- Saber-Tehrani, M.; Givianrad, M.H.; Hashemi Moghaddam, H.; Talanta. 2007, 3, 987-1447.
- Adams, R.P.; Identification of Essential Oil Components by Gas Chromatography/Mass Spectrometry. 4th ed Allured Publishing Corporation; Austria. (2007).

This work is licensed under a Creative Commons Attribution 4.0 International License.
![]()
A New Edition of Web of Science
Journal Impact Factor
2022: 0.5
Five Year: 0.8
Journal is Indexed in

Cabells Whitelist
![]()


