A Sensitive Voltammetric Sensor for Determination of Glutathione Based on Multiwall Carbon Nanotubes Paste Electrode Incorporating Pyrogallol Red
Mohsen Keyvanfard*, Khadijeh Alizad
Department of Chemistry, Majlesi Branch, Islamic Azad University, Isfahan, Iran
DOI : http://dx.doi.org/10.13005/ojc/300226
Article Received on :
Article Accepted on :
Article Published : 31 May 2014
A new sensitive and selective electrochemical sensor was developed for determination of glutathione (GSH) at the surface of carbon paste electrode (CPE) modified with multi-wall carbon nanotubes (MWCNTs) as a sensor and pyrogallol red (PGR) as a mediator. The mechanism of GSH electrochemical behavior at the modified electrode surface was investigated by various electrochemical techniques including chronoamperometry, cyclic voltammetry (CV) and square wave voltammetry (SWV). A linear calibration curve was obtained in the concentration range of GSH of 0.3–500 μmol L–1, with a limit of detection of 0.19 μmol L–1. The method was applied to the determination of GSH in urine samples with satisfactory results.
KEYWORDS:Glutathione; Pyrogallol red; Voltammetry; Multiwall carbon nanotubes.
Download this article as:| Copy the following to cite this article: Keyvanfard M, Alizad K. A Sensitive Voltammetric Sensor for Determination of Glutathione Based on Multiwall Carbon Nanotubes Paste Electrode Incorporating Pyrogallol Red. Orient J Chem 2014;30(2). |
| Copy the following to cite this URL: Keyvanfard M, Alizad K. A Sensitive Voltammetric Sensor for Determination of Glutathione Based on Multiwall Carbon Nanotubes Paste Electrode Incorporating Pyrogallol Red. Orient J Chem 2014;30(2). Available from: http://www.orientjchem.org/?p=3476 |
INTRODUCTION
In researches a wide variety of modifiers nanomaterials have been used with Carbon paste electrode1-10. MWCNTs used as a proper sample for the modification of electrodes because fascinating properties such as high chemical stability, good electrical conductivity, extremely high mechanical strength, high electrocatalytic effect, and ability to promote electron-transfer reaction11, 12.
The electrochemical methods use chemical modified electrodes (CMEs) due to their ability to catalyze the electrode process via significant decreasing of overpotential toward unmodified electrode for the detection of the trace amounts of biological important compounds13, 14. In addition, selective interaction of the electron mediator with the target analyte in a coordination fashion, CMEs are capable to considerably enhance the selectivity and sensitivity in the electroanalytical methods15.
Tripeptide Glutathione is the major intracellular thiol found in microorganisms, plants, and mammalian tissues16. GSH provides reducing capacity for several reactions and plays a vital role in human metabolism, including the detoxification of hydrogen peroxide, xenobiotics, other peroxide, cell homeostasis, radioprotection, antioxidant defense, and free radicals17.
Hence simple, rapid, highly sensitive and accurate methods are required for the determination of trace amount of glutathione in samples. Several methods have been reported for the determination of GSH. These, include chemiluminescence18, High Performance Liquid Chromatography (HPLC)19-21, capillary electrophores22-26, derivatization methods27, liquid chromatography–tandem mass spectrometry (LC–MS/MS)28, liquid chromatography–electrospray mass spectrometric (HPLC–ESI-MS)29, liquid chromatography-Electrochemical Method30-32, Electrochemical methods provide useful alternatives since they allow faster, cheaper and safer analysis33-40.
To our knowledge, no study has reported the electrocatalytic and determination of glutathione by using pyrogallol red modified carbon nanotube paste electrode (PGRMWCNTPE). Thus, in this study, we described initially the preparation and suitability of a PGRMWCNTPE as a new electrode in the electrocatalysis and determination of GSH in a PBS buffer solution and then we evaluated the analytical performance of the modified electrode in quantification of GSH. Finally, in order to demonstrate the catalytic ability of the modified electrode in the electrooxidation of GSH in real samples, we examined this method for the voltammetric determination of GSH in urine samples.
EXPERIMENTAL
Reagents and Apparatus
All the Electrochemical measurements were performed using an Autolab PGSTAT 302N, potentiostat/galvanostat (Utrecht, The Netherlands) connected to a three-electrode cell, Metrohm (Herisau, Switzerland) Model 663 VA stand, linked with a computer (Pentium IV, 1,200 MHz) and with Autolab software. An Ag/AgCl/KClsat, a platinum wire, and a PGRMWCNTPE were used as reference, auxiliary and working electrodes, respectively. The electrode prepared with carbon nanotubes was characterized by scanning electron microscopy (SEM) (Seron Tech. AIS 2100). A digital pH/mV meter (Metrohm model 710) was applied for pH measurements. GSH, PGR, graphite powder, carbon nanotubes, paraffin oil and reagents were analytical grade from Merck. The Phosphate buffer solutions were prepared from sodium dihydrogen phosphate and disodium monohydrogen phosphate plus sodium hydroxide, 0.1 mol L–1 solutions with different pH values were used.
Preparation of the Electrode
For preparation of PGRMWCNTPE, a 1% (w/w) Pyrogallol red spiked carbon powder was made by dissolving the given quantity of Pyrogallol red in diethyl ether and hand mixing with 90 times its weight of graphite powder and 9% (w/w) carbon nanotubes with a mortar and pestle. The solvent was evaporated by stirring. A 1:1 (w/w) mixture of 1% Pyrogallol red spiked carbon powder and paraffin oil was blended by hand mixing and the resulting paste was inserted in the bottom of a glass tube. The electrical connection was implemented by a copper wire lead fitted into a glass tube. When necessary, a new surface was obtained by pushing an excess of the paste out of the tube and polishing it on a weighing paper. We have recently constructed PGRMWCNTPE and studied its electrochemical properties in buffered aqueous solution by CV, SWV and double step potential chronoamperometry. The unmodified carbon paste electrode (CPE) was prepared in the same way without adding pyrogallol red and carbon nanotubes to the mixture to be used for comparison purposes.
Preparation of Real Samples
Urine sample was stored in a refrigerator immediately after collection. Five milliliters of the sample was centrifuged for 20 min at 2500 rpm. The supernatant was filtered through a 0.45 μm filter and then diluted 5-times with water. The solution was transferred into the voltammetric cell to be analyzed without any further pretreatment. The standard addition method was used for the determination of GSH in real samples.
RESULTS and DISCUSSION
SEM Characterization
Figure 1 displays a typical morphology characterized by scanning electron microscope (SEM) of carbon paste electrode (A) and PGRMWCNTPE electrode (B). As shown in Figure 1B, PGR distributed on the surface of MWCNTs and it did not change the morphology of MWCNTs. It indicates that the PGR and multiwall carbon nanotubes distribute almost homogeneously at the surface of the carbon paste matrix, exhibiting a special three-dimensional structure.
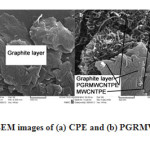 |
Figure 1: SEM images of (a) CPE and (b) PGRMWCNTPE. |
Electrochemistry of the Pyrogallol Red
Figure 2 (insert) depicts the electrochemical properties of the PGRMWCNTPE electrode using cyclic voltammetry in a PBS buffer solution (pH 7.0) at various scan rates. The experimental results showed a well-defined and reproducible anodic and cathodic peak related to the PGR(Red)/ PGR(Ox) redox couple with quasi-reversible behavior, with peak separation potential of ΔEp (Epa–Epc = 120 mV). These cyclic voltammograms were used to scrutinize the variation of peak current versus the square root of potential scan rates. The plots of the anodic and cathodic peak currents the plots of anodic peak currents against the sweep rate show that the Ip values vary linearly with ν1/2 with a correlation coefficient of 0.9927 at all scan rates. This behavior indicates that the nature of the redox system obeys the Nernstian behavior and process is diffusion controlled.
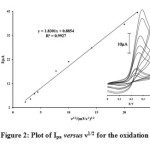 |
Figure 2: Plot of Ipa versus ν1/2 for the oxidation of PGRMWCNTPE. Inset: cyclic voltammograms at various scan rates, (1) 5; (2) 10; (3) 15; (4) 20; (5) 60; (6) 100; (7) 200; (8) 400 and (9) 500 mV s–1 in 0.1 mol L−1 PBS (pH 7.0). |
Catalytic Effect
Figure 3 shows the voltammetric behavior in pH 7.0 from the electrochemical oxidation of 500 μmol L–1 GSH at the PGRMWCNTPE (curve c), at PGRCPE (curve b), at curves d and e are as c, b respectively, without PGR. Curves (a) and (f) depicts the peaks potential of the buffer solution (without GSH) at PGRMWCNTPE and at the unmodified CPE (curve f), respectively. As can be seen, the anodic peak potential for the oxidation of GSH at PGRMWCNTPE (curve c) and at PGRCPE (curve b) are about 257 and 260 mV, respectively., while those at MWCNTPE (curve d) and at the unmodified CPE (curve e) are about 709 mV. For example, results show that the peak potential of GSH oxidation at the PGRMWCNTPE (curve c) shifted by about 449 and 452 mV less positive potential values when compared with that at the MWCNTPE and CPE (curve d and e), respectively. From these results, it was concluded that the best electrocatalytic effect for GSH oxidation was observed that a dramatic enhancement of the anodic peak current occurred at PGRMWCNTPE (curve c), the value obtained with carbon paste electrode. The sensor constructs large anodic peak current in the presence of GSH without a cathodic counterpart (curve c and b). That the current observed is associated with GSH oxidation and not the oxidation of modifier is demonstrated by comparing the current without GSH (curve a) with the one in the presence of GSH (curve b or c).
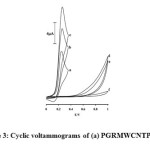 |
Figure 3: Cyclic voltammograms of (a) PGRMWCNTPE in 0.1 mol L−1 PBS (pH 7.0), (b) 500 μmol L−1 GSH at a PGRCPE, (c) 500 μmol L−1 GSH at a PGRMWCNTPE, (d) 500 μmol L−1 GSH at a MWCNTPE, (e) 500 μmol L−1 GSH at a carbon paste electrode, (f) for the buffer solution at the surface of unmodified electrode (CPE); scan rate of 20 mV s−1. |
The process corresponds to an EC´ (catalytic) mechanism (see scheme 1), where the electrochemically formed PGR(Ox) reacts chemically with GSH diffused toward the electrode surface, while the simultaneous oxidation of the regenerated PGR(Red) causes an increase in the anodic current. For the same reason, the cathodic current of the modified electrode is smaller in the presence of GSH.
 |
Scheme 1: Electrocatalytic mechanism for determination of GSH at the surface of PGRMWCNTP |
The effects of scan rate on the electrocatalytic oxidation of 400 µmol L-1 GSH at PGRMWCNTPE was examined by cyclic voltammetry in PBS buffer (pH 7.0) (Figure 4). The peak current increased linearly with the increasing the square root of scan rate (ν1/2) in the range of 2 to 25 mV s–1 and the regression equation for this plot is: Ip = 1.9341X+0.9386 with R2 = 0.9931. This demonstrates a diffusion-controlled electrochemical process.
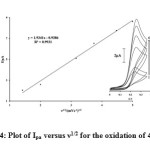 |
Figure 4: Plot of Ipa versus ν1/2 for the oxidation of 400 μmol L−1 GSH at the surface of PGRMWCNTPE. Inset-Cyclic voltammograms of 400 μmol L−1 GSH at a PGRMWCNTPE at various scan rates: (1) 2, (2) 4, (3) 10, (4) 14, (5) 20 and (6) 25 mV s−1 in 0.1 mol L−1 buffer solution (pH 7.0). |
To obtain further information on the rate determining step, we used the Tafel plot to determine the electron transfer coefficient (α) in the catalytic oxidation process (Figure 5). The slope of the Tafel plot was equal to n(1− α)F/2.3RT, which came up to 9.5878 V decade−1. We obtained nα as 0.43. Assuming n = 1, then α=0.43.
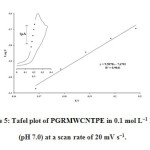 |
Figure 5: Tafel plot of PGRMWCNTPE in 0.1 mol L−1 PBS (pH 7.0) at a scan rate of 20 mV s−1. |
Chronoamperometric study
For determination of the diffusion coefficient of GSH (D), double step potential chronoamperometry was also employed to investigate the electrochemical behavior with various concentrations of GSH at PGRMWCNTPE. The working electrode potential was set at 0.50 V (first step) and 0.45 V (second step) vs. Ag/AgCl/KClsat in a PBS buffer solution (pH 7.0) (Figure 6A). As can be seen, there is no net anodic current corresponding to the oxidation of the mediator in the presence of GSH. On the other hand, the forward and backward potential step chronoamperometry for the mediator in the absence of GSH shows symmetrical chronoamperogram with an equal charge consumed for the reduction and oxidation of PGRMWCNTPE (Figure 6B, a/). On the other hand, the charge value associated with forward chronoamperometry in the presence of GSH is significantly greater than that observed for backward chronoamperometry (Figure 6B, b/-d/). Furthermore, there is no net anodic current corresponding to the oxidation of PGRMWCNTPE in the presence of GSH. The linearity of the electrocatalytic current vs. υ1/2 shows that the current is controlled by GSH diffusion from the bulk solution toward the surface of the electrode, leading to a near Cottrellian behavior. A plot of I vs. t–1/2 for different concentrations of GSH at the surface of PGRMWCNTPE yields straight lines (Figure 6C) with different slopes which can be used to estimate the diffusion coefficient of GSH (D) in the ranges of 350 to 500 μmol L-1. The mean value of D for GSH was found to be 8.73 × 10⁻⁵ cm2 s–1.
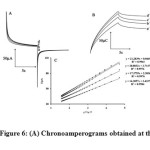 |
Figure 6: (A) Chronoamperograms obtained at the PGRMWCNTPE in the absence (a) and in the presence of (b) 350, (b) 450 and (d) 500 μmol L−1 GSH in a buffer solution (pH 7.0). (B) The charge-time curves (a/) for curve (a), (b/) for curve (b), (c/) for curve (c), and (d/) for curve (d). (C) Cottrell’s plot for the data from the chronoamperograms. |
DYNAMIC RANGE and LIMIT of DETECTION
Square wave voltammetry (SWV) was used for determination of GSH. The SW voltammograms patently showed linear dynamic range that the plot of the peak current versus GSH concentration was linear for 0.3–500.0 µmol L-1 with a regression equation of Ip(µA) = 0.0308CGSH + 37.2064 (R2 = 0.9950, n= 9) where C is µmol L-1 concentration of GSH and Ip is the peak current. The detection limit was determined as 0.19 µmol L-1 GSH according to the definition of YLOD=YB+3σ.
INTERFERENCE STUDY
In order to evaluate the selectivity of the proposed sensor for the determination of GSH, the influence of various foreign species on the determination of 5.0 µmol L–1 GSH was investigated. The tolerance limit was taken as the maximum concentration of the foreign substances, which caused an approximately ±5% relative error in the determination. The results are presented in Table 1. Although ascorbic acid shows interference, its interference can be minimized, if necessary, by using the ascorbic oxidase enzyme, which exhibits high selectivity for the oxidation of ascorbic acid.
Table 1. Interference study for the determination of 5.0 µmol L-1 GSH under the optimized conditions.
| Species | Tolerance limits (W/W) |
| Glucose, Fructose, Lactose, Sucrose, Glycine, Threonine, Na+, Cl–, NO3– |
1000 |
| Ethanol, Urea |
700 |
| Thiourea |
100 |
| Ascorbic acid |
2 |
DETERMINATION of GSH in REAL SAMPLES
In order to demonstrate the ability of the modified electrode to determine GSH in real samples, these compounds were determined in urine samples. The results are presented in Table 2. Clearly, modified electrode is capable of voltammetric determination of GSH with high selectivity and good reproducibility.
Table 2. Determination of GSH in real samples (n=5).
| Sample | Added (µmol L-1) |
Expected (µmol L-1) |
Founded (µmol L-1) |
Recovery (%) |
| Urine | — 5 10 |
— 5 10 |
<LOD 5.2±0.02 9.7±0.08 |
—
|
CONCLUSION
This work demonstrates the construction of a carbon nanotube paste electrode chemically modified using Pyrogallol red. This voltammetric sensor is simple to prepare, and surface renewal is easy. The electrochemical behavior of Pyrogallol red has been studied by cyclic voltammetry and chronoamperometry in both the absence and presence of glutathione. The results showed that the oxidation of glutathione is catalyzed at pH 7.0, where the peak potential of Glutathione is shifted by 449 mV to less positive value at surface of the modified electrode. Using square wave voltammetry, GSH in mixture can each be measured independently from each other with a potential difference of 449 mV. Finally, this modified electrode used for determination of GSH in real sample.
ACKNOWLEDGMENTS
The authors wish to thank Majlesi Branch, Islamic Azad University, for their support.
REFERENCES
- Akhgar, M. R., Salari, M., Zamani, H., Changizi, A., Hosseini-Mahdiabad, H., Int. J. Electrochem. Sci, 5: 782 (2010).
- Ramezani, S., Ghobadi, M., Bideh, B. N., Sens. Actuators, B, 192: 648 (2014).
- Sanghavi, B. J., Srivastava, A. K., Analyst, 138: 1395 (2013).
- Afkhami, A., Soltani-Felehgari, F., Madrakian, T., Ghaedi, H., Biosens. Bioelectron., 51: 379 (2014).
- Afkhami, A., Khoshsafar, H., Bagheri, H., Madrakian, T., Mater. Sci. Eng., C, 35: 8 (2014).
- Karimi-Maleh, H., Keyvanfard, M., Alizad, K., Fouladgar, M., Beitollahi, H., Mokhtari, A., Gholami-Orimi, F., Int. J. Electrochem. Sci, 6: 6141 (2011).
- Keyvanfard, M., Ensafi, A. A., Karimi-Maleh, H., Alizad, K., Analytical Methods, 4: 3268 (2012).
- Keyvanfard, M., Khosravi, V., Karimi-Maleh, H., Alizad, K., Rezaei, B., J. Mol. Liq., 177: 182 (2013).
- Keyvanfard, M., Sami, S., Karimi-Maleh, H., Alizad, K., J. Brazil. Chem. Soc., 24: 32 (2013).
- Keyvanfard, M., Shakeri, R., Karimi-Maleh, H., Alizad, K., Mater. Sci. Eng., C, 33: 811 (2013).
- Wang, J., Electroanalysis, 17: 7 (2005).
- Wildgoose, G. G., Banks, C. E., Leventis, H. C., Compton, R. G., Microchim. Acta, 152: 187 (2006).
- Zhu, Z., Li, X., Zeng, Y., Sun, W., Biosens. Bioelectron., 25: 2313 (2010).
- Yuan, B., Zhang, R., Jiao, X., Li, J., Shi, H., Zhang, D., Electrochem. Commun., 40: 92 (2014).
- Lin, C.-Y., Lai, Y.-H., Balamurugan, A., Vittal, R., Lin, C.-W., Ho, K.-C., Talanta, 82: 340 (2010).
- Meister, A., J. Biol. Chem., 263: 17205 (1988).
- Halliwell, B., Gutteridge, J. M., Free radicals in biology and medicine, Oxford university press Oxford, 1999.
- Chaichi, M. J., Ehsani, M., Khajvand, T., Golchoubian, H., Rezaee, E., Spectrochim. Acta, A, 122: 405 (2014).
- Ferin, R., Pavão, M. L., Baptista, J., J. Chromatogr. B, 911: 15 (2012).
- Hami, Z., Amini, M., Kiani, A., Ghazi-khansari, M., Iran. J. Pharm. Res., 12: 911 (2013).
- Soliman, R. M., Hadad, G. M., Abdel Salam, R. A., Mesbah, M. K., J. Liq. Chromatogr. Related Technol., 37: 548 (2013).
- Kazarjan, J., Vaher, M., Mahlapuu, R., Hansen, M., Soomets, U., Kaljurand, M., Electrophoresis, 34: 1820 (2013).
- Tsardaka, E.-C., Zacharis, C. K., Tzanavaras, P. D., Zotou, A., J. Chromatogr. A, 1300: 204 (2013).
- Ji, Y., Ma, Y., Sun, X., Analytical Methods, 5: 1542 (2013).
- Wang, W., Xin, H., Shao, H., Jin, W., J. Chromatogr. B, 789: 425 (2003).
- Carru, C., Zinellu, A., Mario Pes, G., Marongiu, G., Tadolini, B., Deiana, L., Electrophoresis, 23: 1716 (2002).
- Zhang, X.-Y., Piao, Y.-L., Cui, S.-Y., Lee, Y.-I., Microchem. J., 112: 1 (2014).
- Moore, T., Le, A., Niemi, A.-K., Kwan, T., Cusmano-Ozog, K., Enns, G. M., Cowan, T. M., J. Chromatogr. B, 929: 51 (2013).
- Camera, E., Rinaldi, M., Briganti, S., Picardo, M., Fanali, S., J. Chromatogr. B, 757: 69 (2001).
- Debets, A. J. J., Van de Straat, R., Voogt, W. H., Vos, H., Vermeulen, N. P. E., Frei, R. W., J. Pharm. Biomed. Anal., 6: 329 (1988).
- Halbert, M. K., Baldwin, R. P., J. Chromatogr. B, 345: 43 (1985).
- Lakritz, J., Plopper, C. G., Buckpitt, A. R., Anal. Biochem., 247: 63 (1997).
- Karimi-Maleh, H., Keyvanfard, M., Alizad, K., Khosravi, V., Asnaashariisfahani, M., Int. J. Electrochem. Sci, 7: 6816 (2012).
- Keyvanfard, M., Karimi-Maleh, H., Alizad, K., Chinese. J. Catal., 34: 0 (2013).
- Turunc, E., Karadeniz, H., Armagan, G., Erdem, A., Yalcin, A., Comb. Chem. High Throughput Screening, 16: 695 (2013).
- Yuan, B., Zeng, X., Deng, D., Xu, C., Liu, L., Zhang, J., Gao, Y., Pang, H., Analytical Methods, 5: 1779 (2013).
- Harfield, J. C., Batchelor-McAuley, C., Compton, R. G., Analyst, 137: 2285 (2012).
- Vacek, J., Petřek, J., Kizek, R., Havel, L., Klejdus, B., Trnková, L., Jelen, F., Bioelectrochemistry, 63: 347 (2004).
- Cubukcu, M., Ertas, F., Anik, U., Microchim. Acta, 180: 93 (2013).
- Mazloum-Ardakani, M., Sheikh-Mohseni, M. A., Mirjalili, B.-F., Electroanalysis, 25: 2021 (2013).

This work is licensed under a Creative Commons Attribution 4.0 International License.
![]()
A New Edition of Web of Science
Journal Impact Factor
2022: 0.5
Five Year: 0.8
Journal is Indexed in

Cabells Whitelist
![]()


