Thermo - Acoustical Studies on Interionic Interactions of Some α-Amino Acids in Aqueous Sucrose Solution at Varying Mass Percentages.
S.Thirumaran and N.Karthikeyan*
*Department of Physics (DDE), Annamalai University, Annamalai nagar-608 002
DOI : http://dx.doi.org/10.13005/ojc/300116
Article Received on : December 05, 2013
Article Accepted on : January 29, 2014
Article Published : 05 Mar 2014
The present study deals with the structure-making and breaking behaviour of some alpha-amino acids in aqueous sucrose (disaccharide) solution at 301.15K. Experimental values of density, viscosity and speed of sound were carried out on the ternary mixtures of water +sucrose + amino acids namely (L-asparagine, L-glutamine L-serine and L-threonine) at 301.15K. The binary solvent mixtures was prepared by taking sucrose at different mass percentages, say at 0%, 5%, 10%, 15%, 20%, and 25% was added with water. The given amino acids under study were added with aqueous solvent under different molarities at normal atmospheric pressure. The related and relevant parameters correlated to our present study such as adiabatic compressibility (b), molar hydration number (nH), apparent molar compressibility (jK), apparent molar volume (jV), limiting apparent molar compressibility (), limiting apparent molar volume () and their associated constants (SK, SV), partial transfer volume (∆) from water to aqueous solution and viscosity B-Coefficient of Jones-Dole equations were meticulously evaluated and eventually this present study predicts dominance of hydrophilic –ionic interactions in the solution. Besides, our investigation also explores about the presence of possible interionic interactions such as solute-solvent, solute-solute, ion-solvent and ion-ion in the solution.
KEYWORDS:molar hydration number; solute-solvent; solute-solute; ion-solvent; viscosity B-Coefficient
Download this article as:| Copy the following to cite this article: Thirumaran S, Karthikeyan N. Thermo- Acoustical Studies on Interionic Interactions of Some α-Amino Acids in Aqueous Sucrose Solution at Varying Mass Percentages.. Orient J Chem 2014;30(1) |
| Copy the following to cite this URL: Thirumaran S, Karthikeyan N. Thermo- Acoustical Studies on Interionic Interactions of Some α-Amino Acids in Aqueous Sucrose Solution at Varying Mass Percentages. Orient J Chem 2014;30(1). Available from: http://www.orientjchem.org/?p=2301 |
Introduction
It is well known that various substances cause changes in the conformation of proteins when present in aqueous-protein solutions. The complex conformational and configurational factors affecting the structure of proteins in solution make the direct study of protein interactions difficult. Therefore, one useful approach is to investigate interactions of the model compounds of proteins, i.e., amino acids in aqueous and mixed-aqueous solution 1-5. The physicochemical properties of amino acids in aqueous solutions provide valuable information on solute–solute and solute–solvent interactions that are important in understanding the stability of proteins, and are implicated in several biochemical and physiological processes in a living cell 6. Water is chosen for preparing mixed solvent because its presence gives rise to hydrophobic forces 7, which are of prime importance in stabilizing the native globular structure of proteins. The interactions of water with the various functional groups of proteins are important factors in determining the conformational stability of proteins2-4. The stabilization of native conformations of biological macromolecules (proteins) is related to several non-covalent interactions including hydrogen-bonding, electrostatic and hydrophobic interactions 9, 10. These interactions are affected by the surrounding solute and solvent molecules; for this reason, the physicochemical properties of proteins are strongly affected by the presence of these solutes. Because of direct solute–solvent interactions and/or alteration of the water structure, these solutes can change many properties of globular proteins, such as their hydration, solubility and the activity of enzymes 1, 4, 5, 11and 12. These interactions are important in understanding the stability of proteins, and are implicated in several biochemical and physiological processes in a living cell13–16. The protein–carbohydrate interactions are important for immunology, biosynthesis, pharmacology, medicine, and cosmetic industry 17, 18. Thus, the properties of amino acids in aqueous-carbohydrate solutions are essential for understanding the chemistry of biological systems 19, 20.
Direct study of solute/solvent interactions is difficult due to complex conformation of biological macromolecules5. Therefore, the convenient approach is to study simpler model compounds i.e. amino acids and peptides, which are the basic components of proteins5, 6. When dissolved in water amino acids convert into zwitterionic forms due to the ionization of their carboxyl (−COOH) and amino groups (NH2). In physiological media, this dipolar character of amino acids has an important bearing on biological functions. Amino acids differ from each other in size, charge, hydrogen-bonding capacity, hydrophobicity and chemical reactivity. Hence, these side chains contribute to the structure and function of proteins, individually and collectively 7.
The protein-carbohydrate interactions are important for immunology, biosynthesis, pharmacology, medicine, and cosmetic industry 21, 17. Thus, the properties of amino acids in aqueous-carbohydrate solutions are essential for understanding the chemistry of biological systems 18,19,22 have studied the volumetric, ultrasonic, and viscometric behavior of L-histidine in aqueous glucose solutions 23 have studied the density, viscosity, and speed of sound of diglycine in aqueous xylose, L(-)arabinose, and D(-)ribose solutions; in aqueous glucose, galatose, and fructose solutions 19 of L-alanine in aqueous fructose solutions 2 and the density of L-alanine and L-valanine in aqueous sucrose solutions 24 have studied the density, viscosity and ultrasonic velocity of L-serine, L-glutamine, and L-aspargine in aqueous glucose solutions.
To the best of our knowledge, no volumetric, ultrasonic, and viscometric studies have been reported on amino acids with polar uncharged side chain in aqueous‑carbohydrate solutions, except the study by 4 who investigated volumetric and viscometric properties of arginine in aqueous-carbohydrate solutions. These considerations led us to undertake the study of α-amino acids (with polar uncharged R group) in aqueous-disaccharide solutions. In recent years, a number of workers have determined the various thermodynamic properties of these model compounds in aqueous solutions containing simple electrolytes having hydrophilic nature 25, 3. But very few studies have been done in aqueous disaccharide solutions 26, 4.
In the present study, we report the densities, r ultrasonic speeds, u and viscosities, h of solutions of α-amino acids in aqueous sucrose solvents taken at regular intervals 0%, 5%, 10%, 15%, 20% and 25% of sucrose, at 301.15 K and at normal atmospheric pressure. An attempt has been carried out in the light following aspects Determination of adiabatic compressibility (β), molar hydration number (nH) as a function of molar concentration of α-amino acids in aqueous sucrose solutions at 301.15K. Determination of apparent molar compressibility (jk), apparent molar volume (jv), limiting apparent molar compressibility (), and its related constants (SK) limiting apparent molar volume and its related constants
(SV), partial transfer volume (∆) from water to aqueous disaccharide solution and To shed more details on the viscometric study, viscosity B-coefficient of Jones– Dole equation has also been evaluated.
Experimental methods
The α-Amino acids (SRL India, mass fraction purity > 0.99) was used after re-crystallization from ethanol–water mixture and dried in vacuum over P2O5 at room temperature for 72 h. Sucrose (E. Merck, Germany, mass fraction purity > 0.998) was used as such without further purification, except drying in oven for 24 h . The aqueous sucrose solutions 0%, 5%, 10%, 15%, 20% and 25% mass percentage of sucrose, were prepared using triple distilled water (conductivity less than 1×10⁻⁶ S.cm-1) and these were used as solvents and amino acids was added of six different molar concentrations (ranging from 0 to 0.1 in step of 0.02). The chemicals were weighed in an electronic digital balance (SHIMADZU AX-200, Japan Make) with a least count of 0.0001g. The density was determined using a 5ml specific gravity bottle by relative measurement method with an accuracy of ±0.01kgm-3. An Ostwald’s viscometer of 10ml capacity was used for the viscosity measurement. Efflux time was determined using a digital chronometer within ±0.01s. An Ultrasonic interferometer having the fixed frequency of 2MHz (Mittal Enterprises, New Delhi-Model: F-81) with an overall accuracy of ±0.1ms-1has been used for velocity measurement. An electronically digital operated constant temperature bath (RAAGA industries, Chennai) has been used to circulate water through the double walled measuring cell made up of steel containing the experimental solution at desired temperature, whose accuracy is maintained at 0.1K.
Results and Discussion
The values of density (ρ), viscosity (η) and speed of sound (U) of α-amino acids in aqueous sucrose solution at 301.15K are shown in Table 1. The related parameters such as adiabatic compressibility (b), molar hydration number (nH), apparent molar compressibility (jk), apparent molar volume (jv), limiting apparent molar compressibility (), limiting apparent molar volume () and their associated constants (SK, SV), partial molar transfer volume (∆) and viscosity A and B-coefficient of Jones-Dole equation were meticulously evaluated and are reported in Table (1-6).
In the all four amino acid systems studied, (from Table-1) our present values of density increase with increase in molar concentration of amino acids as well as mass percentage of sucrose content. The other measured parameter ultrasonic velocity (U) which is also found (from Table-2) to be increased with increase in same concentration of amino acids as well as aqueous sucrose content. Such an observed increase in the ultrasonic velocity in these solutions may be attributed to the cohesion brought about by the ionic hydration; which may also be due to the overall increase of cohesion brought about by solute-solute and solute-solvent interaction in solution.
Incidentally, the density (ρ) which is a measure of solute-solvent interactions, which can be attributed as increase of density with concentration indicates the increase in solute-solvent interactions, whereas the decrease in density indicates the lesser magnitude of solute-solvent interactions. Increase in density with concentration is due to the shrinkage in the volume which in turn is due to the presence of solute molecules. As observed in Table-1, an increasing trend of density values may be interpreted to the structure-making behavior of the solvent due to the added solute 27.
Table-1 Values of Density (ρ) and Viscosity (η) of amino acids in aqueous Sucrose solution at 301.15K
| Molarity M/(mol.dm-3) |
Density( r)(kg/m3) |
Viscosity (h)/(×10-3 Nsm-2) |
|||||||||||
|
0% |
5% | 10% | 15% | 20% | 25% |
0% |
5% | 10% | 15% | 20% | 25% | ||
| System-I (Water + Sucrose + L-glutamine) | |||||||||||||
|
0.00 |
996.59 |
1007.48 |
1026.13 |
1042.46 |
1061.30 |
1080.41 |
0.8836 |
1.3967 |
1.5598 |
1.9232 |
2.3428 |
2.7624 |
|
|
0.02 |
999.94 |
1009.37 |
1028.91 |
1045.29 |
1065.33 |
1086.18 |
0.9099 |
1.3156 |
1.5737 |
1.9366 |
2.3609 |
2.7786 |
|
|
0.04 |
1001.03 |
1010.98 |
1029.81 |
1046.40 |
1066.54 |
1087.29 |
0.9162 |
1.3326 |
1.5862 |
1.9497 |
2.3734 |
2.7834 |
|
|
0.06 |
1002.19 |
1012.03 |
1030.89 |
1047.51 |
1067.76 |
1088.47 |
0.9223 |
1.3442 |
1.5992 |
1.9623 |
2.3853 |
2.7997 |
|
|
0.08 |
1003.43 |
1013.17 |
1031.96 |
1048.76 |
1068.96 |
1089.54 |
0.9291 |
1.3561 |
1.6106 |
1.9750 |
2.3978 |
2.8056 |
|
|
0.10 |
1004.52 |
1014.26 |
1032.99 |
1049.87 |
1069.99 |
1090.62 |
0.9389 |
1.3681 |
1.6227 |
1.9882 |
2.4108 |
2.8175 |
|
| System-II (Water + Sucrose + L-asparagine) | |||||||||||||
|
0.00 |
996.59 |
1007.48 |
1026.13 |
1042.46 |
1061.30 |
1080.41 |
0.8836 |
1.2967 |
1.5598 |
1.9232 |
2.3428 |
2.7624 |
|
|
0.02 |
999.21 |
1008.96 |
1028.04 |
1044.48 |
1064.93 |
1085.38 |
0.9149 |
1.3291 |
1.5832 |
1.9465 |
2.3668 |
2.7893 |
|
|
0.04 |
1000.56 |
1010.01 |
1029.09 |
1045.62 |
1065.99 |
1086.59 |
0.9255 |
1.3411 |
1.5955 |
1.9590 |
2.3792 |
2.7984 |
|
|
0.06 |
1001.79 |
1011.11 |
1029.99 |
1046.70 |
1067.08 |
1087.66 |
0.9360 |
1.3531 |
1.6070 |
1.9706 |
2.3911 |
2.8023 |
|
|
0.08 |
1002.92 |
1012.26 |
1030.93 |
1047.98 |
1068.02 |
1088.74 |
0.9469 |
1.3652 |
1.6199 |
1.9824 |
2.4043 |
2.8167 |
|
|
0.10 |
1003.89 |
1013.98 |
1031.96 |
1048.95 |
1068.98 |
1089.82 |
0.9581 |
1.3773 |
1.6313 |
1.9948 |
2.4170 |
2.8245 |
|
| System-III (Water + Sucrose + L-serine) | |||||||||||||
|
0.00 |
996.59 |
1007.48 |
1026.13 |
1042.46 |
1061.30 |
1080.41 |
0.8836 |
1.2967 |
1.5598 |
1.9232 |
2.3428 |
2.7624 |
|
|
0.02 |
998.69 |
1007.01 |
1027.64 |
1043.04 |
1062.18 |
1081.27 |
0.9210 |
1.3484 |
1.6018 |
1.9660 |
2.3868 |
2.8012 |
|
|
0.04 |
1000.12 |
1008.69 |
1028.79 |
1044.71 |
1063.74 |
1083.21 |
0.9317 |
1.3595 |
1.6135 |
1.9779 |
2.3989 |
2.8124 |
|
|
0.06 |
1000.83 |
1010.96 |
1029.67 |
1046.13 |
1065.89 |
1085.29 |
0.9424 |
1.3714 |
1.6234 |
1.9901 |
2.4310 |
2.8218 |
|
|
0.08 |
1001.99 |
1011.94 |
1030.24 |
1047.37 |
1066.99 |
1087.72 |
0.9532 |
1.3829 |
1.6379 |
2.0018 |
2.4228 |
2.8329 |
|
|
0.10 |
1002.96 |
1012.86 |
1031.01 |
1048.39 |
1068.19 |
1088.78 |
0.9640 |
1.3944 |
1.6496 |
2.0140 |
2.4355 |
2.8423 |
|
| System-IV (Water + Sucrose + L-theronine) | |||||||||||||
|
0.00 |
996.59 |
1006.48 |
1026.13 |
1042.46 |
1061.30 |
1080.41 |
0.8836 |
1.2967 |
1.5598 |
1.9232 |
2.3428 |
2.7624 |
|
|
0.02 |
998.99 |
1008.64 |
1027.99 |
1043.96 |
1064.23 |
1082.21 |
0.9121 |
1.3387 |
1.5925 |
1.9560 |
2.3771 |
2.7984 |
|
|
0.04 |
1000.87 |
1010.39 |
1028.91 |
1044.89 |
1065.35 |
1084.27 |
0.9222 |
1.3417 |
1.6034 |
1.9679 |
2.3883 |
2.8075 |
|
|
0.06 |
1001.24 |
1011.37 |
1029.89 |
1046.33 |
1066.14 |
1086.39 |
0.9379 |
1.3613 |
1.6155 |
1.9801 |
2.4015 |
2.8154 |
|
| 0.08 |
1002.36 |
1012.15 |
1030.78 |
1047.94 |
1067.41 |
1088.70 |
0.9435 |
1.3730 |
1.6278 |
1.9923 |
2.4139 |
2.8247 |
|
|
0.10 |
1003.19 |
1013.06 |
1031.14 |
1048.67 |
1068.49 |
1089.68 |
0.9591 |
1.3846 |
1.6401 |
2.0045 |
2.4258 |
2.8313 |
|
Table-2 Values of Ultrasonic velocity (U) and pH of amino acids in aqueous sucrose solution at 301.15K
| Molarity M/(mol.dm-3) |
U/(m/s) |
pH |
|||||||||||
|
0% |
5% | 10% | 15% | 20% | 25% |
0% |
5% | 10% | 15% | 20% | 25% | ||
| System-I (Water + Sucrose + L-glutamine) | |||||||||||||
|
0.00 |
1502.7 |
1514.8 |
1529.4 |
1546.6 |
1561.6 |
1578.3 |
7.0 |
7.5 |
7.7 |
7.9 |
8.1 |
8.4 |
|
|
0.02 |
1504.9 |
1525.2 |
1536.1 |
1554.4 |
1569.4 |
1586.4 |
5.3 |
6.2 |
6.3 |
6.4 |
6.5 |
6.7 |
|
|
0.04 |
1506.3 |
1527.6 |
1538.9 |
1556.9 |
1571.7 |
1588.4 |
5.1 |
6.1 |
6.2 |
6.3 |
6.4 |
6.6 |
|
|
0.06 |
1508.9 |
1529.3 |
1540.3 |
1558.4 |
1573.9 |
1590.2 |
5.0 |
6.0 |
6.1 |
6.2 |
6.3 | 6.5 | |
|
0.08 |
1510.2 |
1531.1 |
1542.1 |
1560.1 |
1575.8 |
1592.4 |
4.9 |
5.9 |
6.0 |
6.1 |
6.2 |
6.3 |
|
|
0.10 |
1512.6 |
1533.9 |
1544.9 |
1562.7 |
1577.9 |
1594.7 |
4.8 |
5.8 |
5.9 |
6.0 |
6.1 |
6.2 |
|
| System-II (Water + Sucrose + L-asparagine) | |||||||||||||
|
0.00 |
1502.7 |
1514.8 |
1529.4 |
1546.6 |
1561.6 |
1578.3 |
7.0 |
7.5 |
7.7 |
7.9 |
8.1 |
8.4 |
|
|
0.02 |
1504.1 |
1522.1 |
1534.8 |
1551.3 |
1566.8 |
1584.0 |
5.9 |
6.0 |
6.2 |
6.3 |
6.4 |
6.5 |
|
|
0.04 |
1506.9 |
1524.7 |
1536.1 |
1553.6 |
1568.9 |
1586.1 |
5.8 |
5.9 |
6.1 |
6.2 |
6.3 |
6.4 |
|
|
0.06 |
1508.8 |
1526.3 |
1538.5 |
1555.1 |
1570.6 |
1588.0 |
5.7 |
5.8 |
6.0 |
6.1 |
6.2 |
6.3 |
|
|
0.08 |
1510.3 |
1528.4 |
1540.7 |
1557.8 |
1572.8 |
1590.4 |
5.6 |
5.7 |
5.9 |
6.0 |
6.1 |
6.2 |
|
|
0.10 |
1512.2 |
1530.9 |
1542.3 |
1559.2 |
1574.5 |
1592.3 |
5.5 |
5.6 |
5.8 |
5.9 |
6.0 |
6.1 |
|
| System-III (Water + Sucrose + L-serine) | |||||||||||||
|
0.00 |
1502.7 |
1514.8 |
1529.4 |
1546.6 |
1561.6 |
1578.3 |
7.0 |
7.5 |
7.7 |
7.9 |
8.1 |
8.4 |
|
|
0.02 |
1503.4 |
1519.2 |
1531.3 |
1548.1 |
1564.7 |
1580.1 |
6.1 |
5.9 |
6.1 |
6.2 |
6.3 |
6.4 |
|
|
0.04 |
1505.1 |
1521.3 |
1533.8 |
1550.4 |
1566.9 |
1582.9 |
5.9 |
5.8 |
6.0 |
6.1 |
6.2 |
6.3 |
|
|
0.06 |
1507.5 |
1523.1 |
1536.3 |
1552.8 |
1568.9 |
1585.9 |
5.8 |
5.7 |
5.9 |
6.0 |
6.1 |
6.2 |
|
|
0.08 |
1509.3 |
1525.8 |
1538.2 |
1554.7 |
1570.7 |
1588.9 |
5.7 |
5.6 |
5.8 |
5.9 |
6.0 |
6.1 |
|
|
0.10 |
1511.0 |
1527.9 |
1540.7 |
1557.9 |
1572.8 |
1590.6 |
5.6 |
5.5 |
5.7 |
5.8 |
5.9 |
6.0 |
|
| System-IV (Water + Sucrose + L-theronine) | |||||||||||||
|
0.00 |
1502.7 |
1514.8 |
1529.4 |
1546.6 |
1561.6 |
1578.3 |
7.0 |
7.5 |
7.7 |
7.9 |
8.1 |
8.4 |
|
|
0.02 |
1503.7 |
1520.1 |
1533.6 |
1549.7 |
1565.1 |
1583.4 |
5.8 |
6.5 |
6.6 |
6.7 |
6.8 |
6.9 |
|
|
0.04 |
1506.6 |
1522.3 |
1535.3 |
1551.3 |
1567.6 |
1585.9 |
5.6 |
6.4 |
6.5 |
6.6 |
6.7 |
6.8 |
|
|
0.06 |
1508.4 |
1524.7 |
1537.9 |
1553.4 |
1569.2 |
1587.3 |
5.5 |
6.3 |
6.4 |
6.5 |
6.6 |
6.7 |
|
| 0.08 |
1510.1 |
1526.9 |
1539.4 |
1555.1 |
1571.7 |
1589.1 |
5.4 |
6.2 |
6.3 |
6.4 |
6.5 |
6.6 |
|
|
0.10 |
1511.7 |
1528.3 |
1541.1 |
1557.7 |
1573.2 |
1591.8 |
5.3 |
6.1 |
6.2 |
6.3 |
6.4 |
6.5 |
|
In the present study, the measured pH values of aqueous solution were found to be less than 8.4 (Table-2) however, these pH values decreases, while increasing molarities of amino acids as well as mass percentage of the sucrose. This can be inferred that at the pH of the solution, the side-chains of the acidic amino acids studies are considered to exist mainly as Zwitterions in aqueous sucrose solution, having mainly the –OH groups. Sugar molecules such as glucose or sucrose is a polyhydroxy compound and its addition to amino acid (with short alkyl chains) aqueous solutions were found to enhance the zwitterions (-CHCOO– and NH3+) hydrophilic – OH group interactions and almost eliminate the of hydrophilic – hydrophobic interactions between the –OH group of sucrose or water and non-polar alkyl chain of amino acids, at higher concentrations. Sucrose molecules have a ring structure and have several –OH groups. It may be infered that when amino acids are added with aqueous sucrose solution, the terminal groups of zwitterions of amino acids, NH3+andCOO– are hydrated in an electrostatic manner whereas, hydration of R group depends on its nature, which may be hydrophilic, hydrophobic or amphiphilic; and the overlap of hydration co-spheres of terminal NH3+ and COO– groups and of adjacent groups results in volume change. This may increase due to reduction in the electrostriction at terminals, whereas it decreases due to disruption of side group hydration by that of the charged end 28.
Table-3 Values of Adiabatic compressibility (β) and Molar hydration number (nH) of amino acids in aqueous sucrose solution at 301.15K
|
Molarity M/(mol.dm-3) |
Adiabatic compressibility b (x10-10 m2N-1) |
Molar hydration number (nH) |
||||||||||
|
0% |
5% |
10% |
15% |
20% |
25% |
0% |
5% |
10% |
15% |
20% |
25% |
|
|
System-I (Water + Sucrose + L-Glutamine) |
||||||||||||
|
0.00 |
4.4436 |
4.3256 |
4.1663 |
4.0103 |
3.8638 |
3.7156 |
– |
– |
– |
– |
– |
– |
|
0.02 |
4.4158 |
4.2588 |
4.1182 |
3.9594 |
3.8110 |
3.6582 |
17.36 |
43.75 |
31.53 |
35.12 |
37.72 |
41.15 |
|
0.04 |
4.4028 |
4.2387 |
4.1003 |
3.9425 |
3.7956 |
3.6453 |
13.28 |
28.30 |
21.79 |
23.24 |
24.24 |
25.94 |
|
0.06 |
4.3825 |
4.2249 |
4.0886 |
3.9308 |
3.7807 |
3.6331 |
12.77 |
21.90 |
17.15 |
18.23 |
19.73 |
20.34 |
|
0.08 |
4.3696 |
4.2102 |
4.0748 |
3.9175 |
3.7673 |
3.6195 |
12.64 |
20.78 |
16.71 |
17.57 |
18.97 |
19.62 |
|
0.10 |
4.3510 |
4.1904 |
4.0560 |
3.9004 |
3.7537 |
3.6055 |
11.81 |
17.11 |
14.63 |
15.21 |
15.78 |
16.39 |
|
System-II (Water + Sucrose + L-Asparagine) |
||||||||||||
|
0.00 |
4.4436 |
4.3257 |
4.1663 |
4.0103 |
3.8638 |
3.7156 |
– |
– |
– |
– |
– |
– |
|
0.02 |
4.4237 |
4.2779 |
4.1293 |
3.9784 |
3.8258 |
3.6720 |
14.72 |
31.24 |
24.62 |
22.06 |
27.70 |
32.38 |
|
0.04 |
4.4013 |
4.2589 |
4.1182 |
3.9623 |
3.8111 |
3.6582 |
13.19 |
21.84 |
15.99 |
16.58 |
18.83 |
21.31 |
|
0.06 |
4.3849 |
4.2454 |
4.1017 |
3.9505 |
3.7990 |
3.6459 |
12.22 |
17.53 |
14.30 |
13.77 |
15.45 |
17.25 |
|
0.08 |
4.3712 |
4.2289 |
4.0863 |
3.9320 |
3.7850 |
3.6313 |
11.29 |
15.84 |
13.29 |
13.45 |
14.09 |
15.65 |
|
0.10 |
4.3560 |
4.2080 |
4.0738 |
3.9214 |
3.7735 |
3.6190 |
10.93 |
15.09 |
12.30 |
12.28 |
12.91 |
14.35 |
|
System-III (Water + Sucrose + L-Serine) |
||||||||||||
|
0.00 |
4.4436 |
4.3256 |
4.1663 |
4.0103 |
3.8638 |
3.7156 |
– |
– |
– |
– |
– |
– |
|
0.02 |
4.4301 |
4.3026 |
4.1499 |
4.0003 |
3.8453 |
3.7042 |
8.40 |
13.98 |
10.93 |
9.28 |
13.23 |
8.46 |
|
0.04 |
4.4138 |
4.2836 |
4.1317 |
3.9821 |
3.8289 |
3.6845 |
10.57 |
14.04 |
11.49 |
9.99 |
12.45 |
11.52 |
|
0.06 |
4.3966 |
4.2639 |
4.1148 |
3.9644 |
3.8115 |
3.6635 |
10.28 |
14.36 |
11.42 |
10.56 |
12.47 |
12.89 |
|
0.08 |
4.3811 |
4.2447 |
4.1023 |
3.9500 |
3.7988 |
3.6415 |
9.93 |
13.35 |
10.62 |
10.27 |
12.86 |
13.74 |
|
0.10 |
4.3670 |
4.2292 |
4.0860 |
3.9300 |
3.7844 |
3.6302 |
9.61 |
12.70 |
10.67 |
11.08 |
11.35 |
12.67 |
|
System-IV (Water + Sucrose + L-Theronine) |
||||||||||||
|
0.00 |
4.4436 |
4.3257 |
4.1665 |
4.0107 |
3.8637 |
3.7153 |
– |
– |
– |
– |
– |
– |
|
0.02 |
4.4270 |
4.2906 |
4.1360 |
3.9886 |
3.8360 |
3.6855 |
26.46 |
17.03 |
20.38 |
15.21 |
20.15 |
22.72 |
|
0.04 |
4.4017 |
4.2708 |
4.1232 |
3.9768 |
3.8197 |
3.6670 |
15.35 |
13.91 |
14.36 |
11.60 |
15.79 |
18.02 |
|
0.06 |
4.3896 |
4.2532 |
4.1053 |
3.9606 |
3.8091 |
3.6533 |
13.91 |
12.93 |
13.50 |
25.25 |
13.03 |
15.32 |
|
0.08 |
4.3748 |
4.2377 |
4.0938 |
3.9459 |
3.7925 |
3.6373 |
12.29 |
12.79 |
12.04 |
11.12 |
12.60 |
14.53 |
|
0.10 |
4.3620 |
4.2261 |
4.0833 |
3.9300 |
3.7814 |
3.6218 |
11.23 |
12.00 |
11.02 |
11.09 |
11.77 |
13.98 |
The adiabatic compressibility (β) of the solute can be expressed as the extent to which hydration around the solute molecule can be expressed. The perusal of Table-3 exhibits the values of adiabatic compressibility (β), which are found to be decreased with increase in molar concentration of solute (aminoacids) as well as mass percentage of sucrose content. Such a decrease in adiabatic compressibility observed in solvent (aqueous sucrose solution) may be attributed to weakening of hydrogen bond in the solution. It is well known fact that when a solute dissolves in a solvent, some of the solvent molecules are attached to the ions (produced from the solutes), because of ion-solvent interaction. Since, the solvent molecules are oriented in the ionic field; these molecules are more compactly packed in the primary salvation shells as compared to the packing in the absence of the ions. This is the reason, why the solvent is compressed by the introduction of the ions. Thus, the electrostatic field of the ions causes the compression of the medium giving rise to a phenomenon called ‘Electrostriction’. Since the water molecules are compressed, they do not respond to a further application of pressure. So the solutions become harder to compress. Consequently, this will lead to in decrease in compressibility values. It may also be inferred that weakening of hydrogen bond strength formed by the solute and solvent molecules may also be the reason for decrease in compressibility 29. The present investigation finds that β values are larger in L-serine system comparing other amino acid systems, advocating the strong molecular association in this system. The Molar hydration number (nH) has been evaluated from
Whereb and b0 are adiabatic compressibility of solution and solvent respectively, n1 and n2 are number of moles of solvent and solute respectively. The hydration number (nH) reflecting the electrostriction effect of the charged centre of the amino acid and in the vicinity of the water molecules. From Table-3, one can observe that the values of nH are positive in all the four liquid systems and such positive values of nH indicate an appreciable salvation of solutes 30. It can be taken as an added support for the structure making nature of solutes as well as the presence of dipolar interactions between the solutes and water molecules. This sensitive parameter also suggests that the compressibility of the solution will be less than that of the solvent, resulting in solutes will gain more mobility and have a more probability of contacting solvent molecules, which in turn may enhance the interaction between the solute solvent molecules. Our present study finds that the values of nH which are decreasing with increasing molar concentration of solute (amino acids) and however, found to be increased with elevation of mass percentage of sucrose. This may suggest that an enhancement of solute-co solute interactions in the mixture. The decreasing values of nH may be presumed as that the strength of the interactions may be weakened among the solute-co solute molecules.
Molar compressibility studies
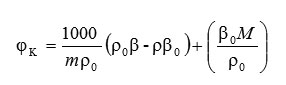
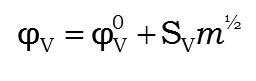
The apparent molar compressibility (φK) of the solute is given by the relation.
in which, m is the molarity of the solution (mol.dm-3),ρo is the density of the solvent (kgm-3) and ρ is the density of the solute, βo and β are the adiabatic compressibility of the solvent and solute, M is the molar mass of the solute (kg.mol-1) respectively.
Table-4 Values of Apparent molar compressibility (φk) and apparent molar volume (φv) of amino acids in aqueous sucrose solution at 301.15K
| MolarityM/(mol.dm-3) | Apparent molar compressibility ϕk (×10-8 m2N-1) |
Apparent molar volume jv (× m3 mo1) |
||||||||||
|
0% |
5% | 10% | 15% | 20% | 25% |
0% |
5% | 10% | 15% | 20% | 25% | |
| System-I (Water + Sucrose + L-glutamine) | ||||||||||||
|
0.00 |
– |
– |
– |
– |
– |
– |
– |
– |
– |
– |
– |
– |
|
0.02 |
-2.7011 |
-3.7441 | -2.9362 |
-2.7064 |
-2.6500 |
-2.4953 |
-167.926 |
-143.424 | -135.31 |
-87.632 |
-81.366 |
-81.778 |
|
0.04 |
-1.9382 |
-2.5480 | -2.0227 |
-1.8826 |
-1.8221 |
-1.6678 |
-111.23 |
-111.630 | -89.514 |
-70.366 |
-76.183 |
-66.506 |
|
0.06 |
-1.5970 |
-2.0036 | -1.6173 |
-1.5222 |
-1.5198 |
-1.3835 |
-93.506 |
-91.759 | -77.170 |
-64.610 |
-65.190 |
-62.495 |
|
0.08 |
-1.4640 |
-1.7471 | -1.4390 |
-1.3673 |
-1.3482 |
-1.2541 |
-85.645 |
-82.941 | -70.876 |
-63.411 |
-62.992 |
-59.217 |
|
0.10 |
-1.4302 |
-1.6431 | -1.3764 |
-1.3081 |
-1.2599 |
-1.3186 |
-79.424 |
-77.153 | -66.710 |
-61.348 |
-61.013 |
-57.342 |
| System-II (Water + Sucrose + L-asparagine) | ||||||||||||
|
0.00 |
– |
– |
– |
– |
– |
– |
– |
– |
– |
– |
– |
– |
|
0.02 |
-1.5320 |
-2.7011 |
-2.2397 |
-1.6036 |
-1.5811 |
-1.8779 |
-131.315 |
-123.070 | -92.939 |
-68.796 |
-38.978 |
-73.460 |
|
0.04 |
-1.4977 |
-1.9382 |
-1.5036 |
-1.3139 |
-1.2566 |
-1.3774 |
-99.457 |
-87.550 | -71.986 |
-58.673 |
-46.751 |
-61.891 |
|
0.06 |
-1.3641 |
-1.5970 |
-1.3368 |
-1.1407 |
-1.0705 |
-1.1682 |
-86.830 |
-76.538 | -62.566 |
-53.673 |
-43.532 |
-56.183 |
|
0.08 |
-1.2563 |
-1.4648 |
-1.2432 |
-1.1435 |
-1.0160 |
-1.0939 |
-79.263 |
-71.653 | -58.343 |
-51.872 |
-42.511 |
-52.982 |
|
0.10 |
-1.2001 |
-1.4044 |
-1.1616 |
-1.0628 |
-0.9527 |
-0.9016 |
-73.117 | -74.385 | -56.686 | -44.537 | -40.203 | -51.709 |
| System-III (Water + Sucrose + L-serine) | ||||||||||||
|
0.00 |
– |
– | – | – | – | – |
– |
– | – | – | – | – |
|
0.02 |
-1.1391 |
-1.2643 | -1.1280 |
-0.6416 |
-0.8660 |
-0.6480 |
-105.239 |
-56.017 | -43.461 |
-20.258 |
-13.079 |
-30.433 |
|
0.04 |
-1.1137 |
-1.2876 | -1.1355 |
-0.7300 |
-0.8791 |
-0.8112 |
-88.432 |
-59.992 | -47.441 |
-29.862 |
-29.097 |
-36.681 |
|
0.06 |
-1.0965 |
-1.3495 | -1.0980 |
-0.8688 |
-0.9222 |
-0.9000 |
-70.788 |
-61.316 | -49.950 |
-41.613 |
-42.131 |
-41.694 |
|
0.08 |
-1.0954 |
-1.3589 | -1.1077 |
-0.8939 |
-0.8774 |
-0.9425 |
-67.611 |
-67.692 | -57.381 |
-46.770 |
-42.170 |
-44.085 |
|
0.10 |
-1.0490 |
-1.2798 | -1.1096 |
-0.9549 |
-0.8222 |
-0.9047 |
-63.798 |
-68.437 | -64.690 |
-47.177 |
-35.598 |
-45.150 |
| System-IV (Water + Sucrose + L-theronine | ||||||||||||
|
0.00 |
– | – | – | – | – | – | – | – | – | – | – | – |
|
0.02 |
-1.3610 |
-2.2167 | -1.8916 |
-0.9927 |
-1.1287 |
-1.4672 |
-120.305 |
-107.201 | -90.529 |
-23.880 |
-34.292 |
-36.925 |
|
0.04 |
-1.5226 |
-1.7911 | -1.3600 |
-0.8801 |
-1.0730 |
-1.2050 |
-107.260 |
-97.016 | -67.627 |
-34.193 |
-43.479 |
-42.941 |
|
0.06 |
-1.1627 |
-1.5568 | -1.2701 |
-0.9494 |
-0.9476 |
-1.0271 |
-77.659 |
-89.150 | -60.968 |
-45.784 |
-42.301 |
-42.787 |
|
0.08 |
-1.1567 |
-1.4032 | -1.1419 |
-0.9451 |
-0.9434 |
-0.9940 |
-72.266 |
-70.314 | -56.542 |
-48.821 |
-40.221 |
-40.536 |
|
0.10 |
-1.0811 |
-1.2772 | -1.0325 |
-0.9061 |
-0.8624 |
-0.9854 |
-66.120 |
-65.271 | -48.721 |
-49.877 |
-38.438 |
-37.680 |
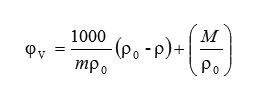
The apparent molar volume (φV) of amino acids has been calculated from the density values of solvent and solution using the relation.
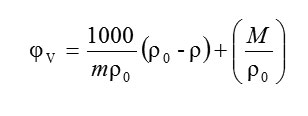
Where m is the molarity of the solution (mol.dm-3), M is the molar mass of the solute (kg.mol-1) and, ρo and ρ are the density values of the solvent and solution respectively.
The following observations are noticed from Table- 4 on apparent molar compressibility (φK) and apparent molar volume (φV) of α-amino acids in aqueous sucrose at 301.15K. The values of the apparent molar compressibility (φK) and apparent molar volume (φV) are all negative over the entire molarity range of amino acids (solute).
The values of apparent molar compressibility (φK) are found to be increased with increasing molarity (m) of solute (amino acids). It is also interesting to note that apparent molar volume (φV) too exhibits the same trend as that of the apparent molar compressibility (φK). However, one can notice from the Table-4, both the values of φK as well as φV in L-serine system decreases with molar concentration of the amino acids, and the same increase with increase of mass percentage of the sucrose content.
Our present investigation observes the values of apparent molar compressibility (φK) and apparent molar volume (φV) are higher in L-serine system over the other amino acids, indicating the molecular association is more pronounced in this system.
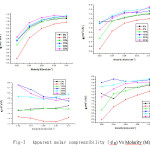 |
Fig-I Apparent molar compressibility (φK) Vs Molarity (M) |
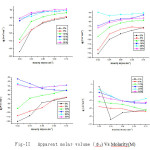 |
Fig-2 Apparent molar volume (φv) Vs Molarity(M) Click here to View Figure |
The above observations clearly suggesting the existence of solute-solvent interaction in the solution. The negative values of apparent molar compressibility indicate the hydrophilic interactions occurring in these systems. Since, more number of water molecules are available at lower concentration of aqueous sucrose, the chances for the penetration of solute molecules in the solvent molecules are highly 31 favored. The decreasing values of apparent molar compressibility and molar volume in L-serine system with increasing molar concentration of solute and solvent content in aqueous medium reveal the strengthening of the solute-solvent interaction.
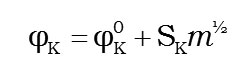
The values of Limiting apparent molar compressibility jk0 in the present study, have been fitted by Least-squares method with the equation Where φk0 is the limiting apparent molar compressibility at infinite dilution and Sk is its associated constant.
The evaluated former parameter Limiting apparent molar compressibility (jk0) which is concerned with the ion-solvent interactions and its later related constant (SK) of the ion-ion interactions in the solution, which are systematically tabulated in Table-5. It is noticed that the jk0 values are negative in all the four liquid systems and increase with increase of mass percentage of sucrose content. From fig-III, the negative values of jk0 for all the systems, and their increasing trend in the present study suggesting the existence of strong ion-solvent interactions. The related constant (SK) whose values are positive in all the systems and however decrease with elevation of sucrose content. Such a decreasing trend of positive values of SK indicates the weakening of ion-ion interactions in the solution. The apparent molar compressibility (jk0) values are found to be higher in L-serine system indicating that molecular association is more pronounced in this system.
Table-5 Values of Limiting apparent molar compressibility[(φk0 )] and limiting apparent molar volume [(φv0 )] and their constant Sk and Sv of amino acids in aqueous sucrose at 301.15 K
|
Amino acids |
Water + sucrose |
(×10-8 m2N-1) |
Sk (×10-8 N-1 m1 mol-1) |
(× m3 mol-1) |
Sv (×10-8 N-1 m1 mol-1) |
|
L-glutamine |
0% |
-17.34 |
87.58 |
-246.74 |
584.84 |
|
5% |
-57.21 |
142.17 |
-232.37 |
462.49 |
|
|
10% |
-44.07 |
106.26 |
-195.63 |
452.57 |
|
|
15% |
-42.52 |
97.54 |
-113.64 |
185.45 |
|
|
20% |
-39.44 |
93.45 |
-108.01 |
161.29 |
|
|
25% |
-35.58 |
81.29 |
-106.25 |
171.39 |
|
|
L-asparagine |
0% |
-18.84 |
21.62 |
-188.12 |
395.42 |
|
5% |
-39.32 |
88.71 |
-167.40 |
339.35 |
|
|
10% |
-31.77 |
70.58 |
-128.93 |
253.90 |
|
|
15% |
-21.47 |
37.55 |
-88.04 |
138.07 |
|
|
20% |
-22.18 |
43.83 |
-45.15 |
11.59 |
|
|
25% |
-27.99 |
63.65 |
-781.20 |
245.17 |
|
|
L-serine |
0% |
-12.87 |
7.74 |
-150.80 |
300.96 |
|
5% |
-13.75 |
0.47 |
46.76 |
-66.94 |
|
|
10% |
-11.90 |
10.27 |
61.58 |
-12.57 |
|
|
15% |
18.60 |
-5.31 |
72.86 |
-178.61 |
|
|
20% |
9.75 |
4.26 |
4.61 |
-155.56 |
|
|
25% |
-15.41 |
-4.75 |
-87.48 |
-18.78 |
|
|
L-threonine |
0% |
-18.98 |
26.94 |
-185.08 |
404.80 |
|
5% |
-29.52 |
65.17 |
-159.66 |
310.41 |
|
|
10% |
-27.05 |
57.35 |
-129.81 |
272.83 |
|
|
15% |
-5.76 |
12.48 |
-86.25 |
192.17 |
|
|
20% |
-14.70 |
20.13 |
-35.30 |
19.76 |
|
|
25% |
-35.30 |
19.76 |
-8.49 |
-18.42 |
The limiting apparent molar volume (φv0) in the present study have been fitted by method of Least-squares with the equation
Where Φv0 Is the limiting apparent molar volume at Infinite dilution and svis its associated constant. The perusal of Table-5 depicts the values of limiting apparent molar volume (jv0) furnishing negative values in all the systems except in system-III, where as reverse trend is observed. And however all the systems increase with increase of mass percentage of sucrose content. Our present study notices that the large values of jv0 observed in L-serine system comparing the other amino acid systems. The electrostriction at Zwitterionic terminals due to ionic-hydrophilic interactions between the Zwitterionic centre of L-serine and the –OH group of sucrose molecules decreases, which in turn, causing the larger values of jv0 of L-serine in aqueous solution. Such large values of jv0 in L-serine in aqueous sucrose solution is due to the strong hydrophilic-ionic interactions in the solution, as sucrose molecule contains a larger number of -OH groups than other disaccharides. Further, it is evident from the same Table-5 that the increasing trend of jv0 values, suggesting the strong ion-solvent interaction in the solution. The possession of such large of jv0 in L-serine system clearly establishing that it serves as an effective structure-maker in the mixture. As seen from the table-5, the values of Sv are positive in all liquid systems and except in L-serine system, where it is found to be decreased with increase of mass percentage of sucrose. Such a decreasing of positive values of Sv clearly indicates the presence of weak ion-ion interactions in the solution 32, 22.
Partial transfer volume studies
where ∆φv0 denotes the transfer volume. The present investigation observes that the partial transfer volume (∆φv0) exhibit positive deviations in all the four liquid systems and increase with elevation of mass percentage of sucrose content except in L-serine, (From Table-6) where it shows a reverse trend.
Table-6 Values of Partial transfer volume (Δφv0 ), A and B co-efficient of Jones – Dole equation of amino acids in aqueous sucrose solution at 301.15 K
|
Amino acids |
Water + Sucrose |
(× 10-3 m3 mol-1) |
(dm3/2mol-½) |
(dm3mol-1) |
|
L-glutamine |
0% |
– |
0.2277 |
-0.1552 |
|
5% |
14.37 |
-0.7251 |
2.2387 |
|
|
10% |
51.11 |
0.0058 |
0.3901 |
|
|
15% |
133.10 |
-0.0018 |
0.3465 |
|
|
20% |
138.73 |
0.0219 |
0.2175 |
|
|
25% |
140.49 |
0.0182 |
0.1362 |
|
|
L-asparagine |
0% |
– |
0.2444 |
0.0164 |
|
5% |
20.72 |
0.1622 |
0.0823 |
|
|
10% |
59.19 |
0.0729 |
0.2195 |
|
|
15% |
100.08 |
0.0597 |
0.1739 |
|
|
20% |
142.97 |
0.0485 |
0.1551 |
|
|
25% |
146.29 |
0.0375 |
0.1213 |
|
|
L-serine |
0% |
– |
0.3154 |
-0.1407 |
|
5% |
197.56 |
0.3271 |
-0.3386 |
|
|
10% |
212.38 |
0.2002 |
-0.0949 |
|
|
15% |
226.66 |
0.1615 |
-0.0625 |
|
|
20% |
155.41 |
0.1416 |
-0.0910 |
|
|
25% |
63.32 |
0.1087 |
-0.0708 |
|
|
L-threonine |
0% |
– |
0.1952 |
0.1944 |
|
5% |
25.42 |
0.2197 |
0.0554 |
|
|
10% |
55.27 |
0.1362 |
0.0587 |
|
|
15% |
98.83 |
0.1102 |
0.0563 |
|
|
20% |
149.78 |
0.0956 |
0.0367 |
|
|
25% |
176.59 |
0.1065 |
0.1026 |
The increasing behavior of partial transfer volume values (∆φv0) shows stronger and more extensive interactions between amino acids (co-solute) and sucrose (solute) and vice versa. It is interesting to note that large value of ∆ are observed in L-serine system The electrostriction at zwitterionic terminals due to ionic-hydrophilic interactions between the zwitterionic centre of amino acids and the –OH group of sucrose molecules decrease, which in turn, cause the larger values of ∆φv0 are dominant in L-serine system over the other co-solutes, which is attributed due to the existence of strong hydrophilic-ionic interaction.
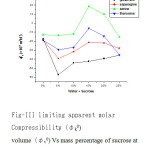 |
Fig-3 limiting apparent molar compressibility (φk0) Click here to View Figure |
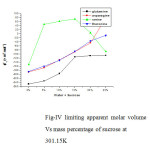 |
Fig-4 limiting apparent molar volume (φv0) Click here to View Figure |
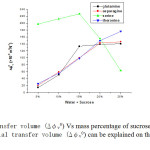 |
Fig-5 Transfer volume (∆φv0) Vs mass percentage of sucrose at 301.15K |
Co-Sphere Overlap Model33 The overlap of ions of co-solute (amino acids) and solute (sucrose) comes into play because of the interaction between (i) ions of solute (amino acids) and hydrophilic, -OH sites of disaccharide (sucrose) molecules, and (ii) ions of co-solutes (disaccharide) and the hydrophobic parts/groups of amino acid molecules. Out of which, the former type of interactions contributes positively, and later type of interactions to negatively to ∆φv0 values. The possession of positive values of ∆φv0 indicates the dominance of hydrophilic–ionic interactions. This may be further interpreted as the overlap of hydration co-spheres of two ionic species results in an enhanced volume as some electrostricted water molecules return to the bulk water with a higher volume contribution then electrostricted water molecules; whereas, overlap of hydration co-spheres of hydrophobic- hydrophobic groups and ion- hydrophobic/hydrophilic- hydrophobic groups and results in a net volume decrease. This may due to greater hydrophilic- ionic groups and hydrophilic- hydrophilic groups interactions, with the presence of more hydroxyl groups in sucrose molecules. Incidentally, the larger values of ∆φv0 are observed in L-serine system comparing its other co-solutes. Hence it is very ambiguous that L-serine identified as an effective structure maker in aqueous sucrose solution as it enhances all possible interionic interactions such as solute-solvent, ion-solvent, solute-co solute etc (except ion-ion) in the mixture. Hence it is very obvious that of all the amino acids, L-serine is an effective structure maker in the present system of the mixture. Similar trend is already noticed by earlier workers, supports our present study 23, 31. In general, the following types of interaction occurring between amino acids and sucrose can be classified as follows 34-37 The hydrophilic- ionic interaction between OH groups of sucrose and zwitterions of amino acid. Hydrophilic- hydrophilic interaction between OH groups of sucrose and OH groups in the side chain of amino acids. Hydrophobic- hydrophilic interaction between OH groups of sucrose molecule and polar (-CH2) in the side chain of amino acid molecul. Hydrophobic- hydrophobic group interaction between the non-polar groups of sucrose and polar (-CH2) in the side chain of amino acid molecule.
Viscometric studies
We have incorporated the viscometric study by employing the Jones-Dole equation 38.
h/h0 = 1=Am1/2+Bm
Where h and h0 are the viscosities of the solution and solvent respectively, m is the molar concentration (mol.dm-3) of the solute. A and B are constants which predict for a solute-solvent system. A is known as the Falkenhagen co-efficient which characteristics the ionic interaction in the solution and B is the Jones-Dole (or) viscosity B co-efficient, which depends on the size of the solute and the nature of the solute-solvent interactions. Viscosity is one of the key transport properties of the solutions. Accurate viscosity data give useful information regarding ion-solvent interactions (long-range electrostatic interaction), which are the controlling force in dilute solutions. Viscosity data are necessary to calculate the physical parameters of Jones-Dole equation, which apply to analyze the experimental data 38, 39. In the present study, the values of B for all studied system are positive and the positive values of the B co-efficient is attributed with structure making (ordering) ions. Our present study finds that the viscosity B co-efficient values are decreasing with increase mass percentage of sucrose content. However, in L-serine system, an increasing trend in observed. It is obvious that the increasing positive values of B in this system clearly attribute the dominance of solute-solvent interactions comparing the other three liquid systems. For identifying the ionic interactions existing in the mixture, which is reflected by the values of A in the present investigation are all positive and decrease with increase of mass percentage of sucrose content (From Table-6), which clearly depicts the weakening of ion-ion interaction in the mixture. This is in well agreement with our earlier conclusion drawn from the associated constants of Sk and Sv.
Conclusion
The acoustical behaviors of α-amino acids in aqueous disaccharide (sucrose) at 301.15 K have been investigated and are summarized as, It is obvious that L-serine serves as an effective structure – maker in the aqueous saccharide solution The addition of solute (amino acids) in the solvent enhances strong molecular interionic interactions such as ion-solvent, solute-solute, and solute-solvent etc., in the present systems of mixtures. and however a weak ion-ion interaction are observed.Our viscometry study lends another fine support about the existence of strong solute-solvent interactions in the solution. The trends of partial transfer volume studies predicting the dominance of ionic-hydrophilic interactions in the mixture. Such predominating ionic-hydrophilic interactions between solute-cosolute are larger in L-serine system comparing the other co-solute systems.
References
- Banipal T. S., Kaur, J. andBanipal, P. K. “Study of interactions between amino acids and zinc chloride in aqueous solutions through volumetric measurments at T=(288.15 to 318.15)K” . J.Chem.Eng.Data. 53, 1803-1816(2008).
- Pal, A., Kumar, S. “Volumetric properties of L-alanine, and L-valine in aqueous sucrose soluions at T= (288.15 and 308.15)K” . J.chem.thermodyn. 35, 1085-1092(2005).
- Nain, A. K. and Chand, D. “Volumetric, ultrasonic, and viscometric behavior of glycine, DL-alanine, and L-valine inaqueous 1,4-butanediol solutions at different temperatures”. J. Chem.Thermodyn. 41, 243–249(2009).
- Zhao, C.,Ma, P. andLi, J. “Partial molar volumes and viscosity coefficients of arginine in aqueous glucose, sucrose and L-ascorbic acid solutions at 298.15K”. J.Chem.Thermodyn.37,37–42(2005).
- Zhuo, K.,Liu, Q., Yang, Y., Ren, Q. andWang, J. “Volumetric and Viscosity Properties of Monosaccharides in Aqueous Amino Acid Solutions at 298.15K”. J.Chem.Eng.Data. 51, 919–927(2006).
- Thirumaran S. and Job sabu, K. “Ultrasonic studies on interionic interactions of some alkali metal halides in aqueous d-glucose solution at varying molarities and temperatures” J.Exp.sci. 3(1), 33-39(2012).
- Roneron C. M., Moreno, E. and Rojas, J. L. “Apparent molar volumes and viscosities of dl-α-alanine in water-alcohol mixtures”. Thermochim.Acta. 328, 33-38(1999).
- Yan, Z., Wang, J., Kong, W. and Lu, J. “Effect of temperature on volumetric and viscosity properties of some α-amino acids in aqueous calcium chloride solutions”. Fluid Phase Equilibria. 215(2), 143–150(2004).
- P.H. Von Hippel, T. Schleich, “Ion effects on the solution structure of biological macromolecules”. Accounts Chem. Res. 2 257–265(1969).
- F. Franks, “Protein stability: the value of ‘old literature”. Biophys. Chem. 96 117–127(2002).
- S. Thirumaran and P. Inbam, “Thermodynamic and transport studies on some basic amino acids in aqueous sodium acetate solution at different temperatures”. Ind.J.Pure.Appl.Phy. 49,451-459(2011)
- Riyazuddeen, M.A. Usmani, “Interactions in (l-alanine/l-threonine + aqueou glucose/aqueous sucrose) systems at (298.15–323.15) K”. Thermochim. Acta. 527 112–117(2012).
- K. Zhuo, Q. Liu, Y. Yang, Q. Ren, J. Wang, “Volumetric and Viscosity Properties of Monosaccharides in Aqueous Amino Acid Solutions at 298.15 K”. J. Chem. Eng. Data. 51, 919–927(2006).
- A.M. Ronero, E. Moreno, J.L. Rojas, “Apparent molal volumes and viscosities of dl-α-alanine in water–alcohol mixtures”. Thermochim. Acta. 328, 33–38(1999).
- S Thirumaran and K.Job sabu, “Ultrasonic investigation of amino acids in aqueous Sodium acetate medium”. Ind.J.Pure.Appl.Phy. 49, 87- 96(2011).
- K. Gekko, “Mecbanism of Polyol-Induced Protein Stabilization: Solubility of Amino acids and Diglycine in Aqueous Polyol Solutions”. J. Biochem. 90, 1633–1641(1981).
- F.J. Millero, A. Lo Surdo, C. Shin, “The apparent molal volumes and adiabatic compressibilities of aqueous amino acids at 25.degree.C”. J. Phys. Chem. 82, 784–792(1978).
- M. Wusteman, S. Boylen, D.E. Pegg, Cryobiology 33, 423–429(1996).
- S. Li, W. Sang, R. Lin, “Partial molar volumes of glycine, l-alanine, and l-serine in aqueous glucose solutions at T=298.15 K”. J. Chem. Thermodyn. 34, 1761–1768(2002).
- A. Pal, N. Chauhan, “Densities, speeds of sound and viscosities of L-alanine in aqueous fructose, maltose and lactose solutions at different temperatures”. Indian J. Chem. 48A 1069–1077(2009).
- Metzler, D. E. “The Chemical Reactions of Living Cells”. vol.1,Academic Press, NewYork.
- Parfenyuk, E. V.,Davydova, O.I., Lebedeva, N.S. “Interaction of D-maltose and sucrose with some amino acids in aqueous solutions”.J.Soln.Chem.33, 1–10(2004).
- Nain, A. K., pal, R. and sharma R. K. “Volumetric, ultrasonic and viscometric behavior of L histidine in aqueous glucose solutions at different temperatures”. J.chem.thermodyn. 43, 603-612(2011).
- Palani, R. and Geetha, A. “Acoustical and thermodynamical studies of L-glutamine and L-asparagine in aqueous D-glucose solutions at 298.15K”. Res.jou.of.phys.1(2), 82-89(2007).
- Harutyunyan, N. G., Harutyunyan, L. R. and Harutyunyan, R. S. “Volumetric properties of amino acids in aqueous solution of non ionic surfactant”. Thermochim.Acta. 498, 124–127(2010).
- Ali, A., Hyder, S., Sabir, S., Chand, D. and Nain, A. “ Volumetric, viscometric, and refractive index behaviour of α-amino acids and their group contribution in aqueous d-glucose solution at different temperatures”. J. Chem. Thermodyn. 38(2), 136–143(2006).
- Thirumaran, S. and Mary, Christina Gardilya, D. “Volumetric and ultrasonic studies on interionic interactions of some amino acids in aqueous magnesium acetate medium at 306.15K”. Rect.Res.Sci.and.Tech. 3(8), 56-63(2011).
- Anil Kumar Nain and Renu Pal. “Volumetric, Ultrasonic and Viscometric studies of solute-solute and solute-solvent interactions of l-theronine in aqueous- sucrose solutions at different temperatures”. J. Chem. Thermodyn. 64, 172–181(2013).
- Thirumaran, S. and Prakash, N. “Volumetric and acoustical behaviour of some amino acids in aqueous magnesium acetate medium”. J. IndianChem.Soc. 89, 497-505(2012).
- Mehra, R., and Sajnami, H. “Acoustical studies in ternary electrolytic mixtures at 25, 35 and 45oC”. Ind.J.PureAppl.Phy. 38, 762-765(2000).
- Thirumaran, S. and Job sabu, K. “Structure-making and breaking behaviour of some α-amino acids in aqueous sodium butyrate medium at 298.15K”. J.Appl.sci. 11(18),3258-3266(2011).
- Riyazuddeen and MohdAmilusmani. “Densities, speeds of sound, and viscosities of (L-proline + Aqueous glucose) and (L-proline + Aqueous sucrose) solutions in the temperature range (298.15 to 323.15K)”. J.Chem.Eng.Data. 56, 3504-3509(2011).
- Gurney, R.W. “Ionic processes in solution”.McGrawHill bookco.,Inc, Newyork., 275-284(1953).
- G.R. Hedwig, H. Hoiland, “Thermodynamic properties of peptide solutions Partial molar isentropic pressure coefficients in aqueous solutions of sequence isomeric tripeptides with a single -CH3 side-chain”. J. Chem. Thermodyn. 25, 349–354(1993).
- A.K. Mishra, J.C. Ahluwalia, “Apparent molal volumes of amino acids, N-acetylamino acids, and peptides in aqueous solutions”. J. Phys. Chem. 88, 86–92(1984).
- S.Banerjee, N. Kishore, “Interactions of Some Amino Acids with Aqueous Tetraethylammonium Bromide at 298.15 K: A Volumetric Approach”. J. Solution Chem. 34, 137–153(2005).
- R. Bhat, N. Kishore, J.C. Ahluwalia, “Thermodynamic studies of transfer of some amino acids and peptides from water to aqueous glucose and sucrose solutions at 298.15 K”. J. Chem. Soc., Faraday Trans. 188, 2651–2665(1988).
- Jones, G., and Dole, M. “The viscosity of aqueous solutions of strong electroytes with special reference to barium chloride”. J.Am.Chem.Soc. 51, 2950-2964(1929).
- Shahjahan, A. “Volumetric and viscometric behaviour of some amino acids, and their group contributions in aqueous tetramethylammonium bromide at different temperatures”.Z.Phys.Chem.222,1519-1532(2008).

This work is licensed under a Creative Commons Attribution 4.0 International License.
![]()
A New Edition of Web of Science
Journal Impact Factor
2022: 0.5
Five Year: 0.8
Journal is Indexed in

Cabells Whitelist
![]()


