Optimization of Sunflower Oil Hydrogenation on Pd-B/γ-Al2O3Catalyst
DOI : http://dx.doi.org/10.13005/ojc/300120
Download this article as:
![]()
Hydrogenation of vegetable oils is a heterogeneous process where the process factors influence the conversion and selectivity. A Statistical study was performed on a sunflower oil (SFO) hydrogenation process using Pd-B/γ-Al2O3 catalyst to study the effect of the process factors, including temperature, hydrogen pressure, agitation, catalyst dose and reaction time on the iodine value and trans fatty acid content of hydrogenated SFO. It was found that each factor has a noticeable effect on the iodine value and trans fatty acid content of hydrogenated SFO. The study was also aimed to find out the optimum values for the hydrogenation factors which are capable to decline the IV to 70 (g iodine per 100 g oil) as well as produce a minimum trans fatty acid content of the hydrogenated SFO. The optimum values were found to be 431 K, 1000 kPa, 1000 kPa, 0.29 % and 42.2 min for the temperature, hydrogen pressure, agitation, catalyst dose and reaction time respectively.
KEYWORDS:Iodine Value; Trans fatty acids
INTRODUCTION
Partial hydrogenation of sunflower oil is an essential process in the oil and fat industries that improves the oxidation stability and thermal properties required for different food and nonfood applications.1, 2 Hydrogenation increases the shelf life and improves the structural plasticity of shortening, margarine and baking fats.3 In the United States, approximately 8 billion pounds of shortening and margarine were produced in 2007.4 Furthermore, to meet European standards (EN14213 and EN14214) for biodiesel main properties (iodine value, cetane number and oxidative stability), the unsaturation degree of the oil and/or fatty acid methyl esters is required to be reduced through a partial hydrogenation process.5 Vegetable oil hydrogenation as a heterogeneous process is influenced by temperature, pressure, agitation, catalyst concentration and reaction time. These factors control the conversion and trans-isomerization selectivity (Si) of the hydrogenated oil .6-9 Iodine value (IV) is an important criterion for oils as an indicatorfor the degree of unsaturation and oxidation stability. In the field of oil hydrogenation, IV is used for monitoring catalyst activity and measuring hydrogenation conversion.10, 11IV declines during hydrogenation as a result of C = C saturation,12in which the decline is related to the nature of the oil, operating conditions as well as catalyst type and concentration.2For different food and nonfood applications, soft oils are usually hydrogenated until IV 70.13 Trans fatty acids (TFAs) are particular fats with specific physical properties, are produced as a by product of the vegetable oil hydrogenation process in a geometrical isomerization process for the C = C double bond of the oil subjected to hydrogenation. 14, 15TFA formation is one of the most weakness for the hydrogenation due to their negative impact on human health. 13 Response surface methodology (RSM) is a statistical method for experimental design,optimization and determination of the relation between different factors affecting a process. RSM optimizes the number of runs and the time required for model-building and interpretation through statistical analysis.16This methodology and central composite design (CCD) can be used to predict oil hydrogenation responses, such as IV.17 The purpose of this study was to use RSM to to determine the optimum values for the hydrogenation factors which are capable to produce HSFO of IV = 70 (g iodine per 100 g oil)as well as minimum TFA content. In other words, this optimization study aims to identify the hydrogenation factors which perform approximately 44 wt.% conversion as well as minimum Si for SFO hydrogenation on Pd–B/γ–Al2O3 catalyst.
MATERIALS AND METHODS
Materials
Pd–B/γ–Al2O3 catalyst prepared using wet impregnation and chemical reduction as previously reported 18was used as a catalyst for sunflower oil (SFO) hydrogenation. The SFO supplied by Yemen Company for Ghee and Soap Industry-YCGSI was used for the statistical study. Chromatographic grade Hydrogen gas (H2)of 99.999 % purity from local market was used for the hydrogenation.
Methods
Design of experiments (DOE)
The CCD was used to design the layout for the hydrogenation experiments and to analyse the results. It was also used to obtain a modeling equation to predict the effect of hydrogenation factors on the IV and TFA content of hydrogenated SFO. The factors, including temperature, hydrogen pressure, agitation, catalyst dose and reaction time were coded at three levels corresponding to the minimum, target and maximum values of each factor as shown in Table1. The CCD was performed using Design-Expert 8.0.7.1 (trial version).
 |
Table 1: Actual and coded values for the SFO hydrogenation factors Click here to View table |
The coded values were designated by –1, 0, +1, –α and +α. Alpha is defined as the distance from the center point and has a maximum value of 2n/4, where n is the number of factors.19Accordingly the value of alpha (α) in this study was 1.41421.
Analytical and calculation procedures
The analyses of the trans-fatty acids content and IV were performed using the corresponding American Oil Chemists’ Society test methods.20
The hydrogenation conversion was calculated using the following equation, as previously described.11
C = C conversion (%) = [(IVo – IVf) / IVo ] (1)
where, IVo is the initial iodine value for SFO (before hydrogenation) and IVf is the corresponding IV of the hydrogenated sample.
The trans-isomerization selectivity as a measure of the catalyst’s tendency to form the TFA was calculated by Equation 2 prviously reported by Lausche et al.21
Si = Δ (% trans fats)/ Δ (% conversion) (2)
RESULTS AND DISCUSSION
Data Analysis for the Hydrogenation Factors
The experimental layout design applied using the CCD, and the results for IV and TFA content of the 50 hydrogenation runs are shown in Table 2. The table includes the results for the 32 factorial points, 10 axial points and 8 replications at the zero level to evaluate the pure error.
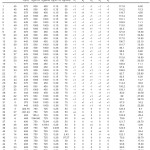 |
Table 2: Experimental design layout and the response values for hydrogenation of SFO on the Pd-B/³-Al2O3 catalyst Click here to View table |
The CCD suggests four models including linear, 2FI, quadratic and cubic polynomials for each response. The quadratic model was suggested for the prediction of IV and TFA content because it exhibited better values for R-squired (R2), lack of fit and prediction error sum of squares (PRESS).
The results of ANOVA, which was performed based on the coded factors are presented in Tables 3 and 4 for IV and TFAs, respectively. The ANOVA results describe the significance and fitness of the models for the prediction of both responses. These results also indicate the effect of the significant terms of SFO hydrogenation factors and their interactions on the IV and TFA content. The results exhibited high Fisher value (F–value) and very low probability (p–value < 0.0001) for both IV and TFA content of hydrogenated SFO. These results imply that the prediction models were significant for both responses. A “Model F–value” this large has only a 0.01% chance that this large could occur because of noise. The low p–value for both models implies that the models were significant for the 95% confidence interval for the prediction of both responses.
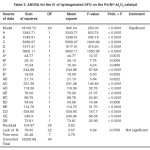 |
Table 3: ANOVA for the IV of hydrogenated SFO on the Pd-B/³-Al2O3 catalyst Click here to View table |
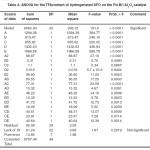 |
Table 4: ANOVA for the TFAcontent of hydrogenated SFO on the Pd-B/³-Al2O3 catalyst Click here to View table |
The terms of the IV prediction model that exhibited “Prob > F” lower than 0.05% indicating a significant effect for the five hydrogenation factors on the IV decline. This effect was occured during SFO hydrogenation on the Pd–B/γ–Al2O3 catalyst at the conditions of the experimental layout previously mentioned in Table 2. However, most terms of the TFA content prediction model also exhibited a highly significant effect for the hydrogenation factors on the Pd–B/γ–Al2O3 catalyst’s tendency for trans fat isomerization. In general, the linear terms have higher impact on both responses, which imply a kind of linear relationship between the five hydrogenation factors and the two responses.
The “Lack of fit F–value” for both responses implies that the “Lack of fit” is not significant relative to the pure error. Non–significant lack of fit is good for the models of both responses. However, the coefficients of determination (R2) for IV and TFA content of HSFO on the Pd–B/γ–Al2O3 catalyst are considered to be sufficient to identify the correlation between the actual and predicted values. Fig.1 and 2 are graphically showing the correlation between the experimental and predicted values of IV and TFA content for hydrogenated SFO on the Pd–B/γ–Al2O3 catalysts.
 |
Fig.1: Actual and coded values of the IV of HASO on Pd-B/³-Al2O3 Click here to View figure |
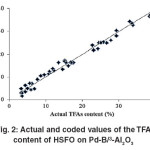 |
Fig. 2: Actual and coded values of the TFA content of HSFO on Pd-B/³-Al2O3 Click here to View figure |
The predicted values are noticeably in good agreement with the experimental values for both responses. Furthermore, the R2 and adjusted R2values were almost convergent as shown in Table 5.
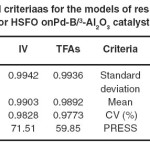 |
Table 5: Statistical criteriaas for the models of response prediction for HSFO onPd-B/³-Al2O3 catalyst Click here to View table |
The high values of adjusted R2confirmed the significance of the model. Beside this, the predicted R2 values are in reasonable agreement with the adjusted R2 values for both responses, indicating that the models have sufficient capability to predict the two responses. Furthermore, adequate precision of the models is > 4 indicating adequate model discrimination.22Models of both prediction responses have acceptable reliability and precision with CV values < 10% .23Furthermore, the model’s predictive ability measured by PRESS is reasonable for IV and TFA content prediction. The experimental results of the CCD and the regression analysis for the coded factors yield the quadratic polynomial equations shown in Table 6 for the prediction of both responses. The terms having p-value > 0.1 were excluded from the equations.
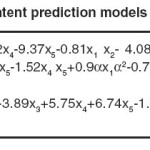 |
Table 6: IV and TFA content prediction models based on coded factors Click here to View table |
Effect of Hydrogenation Factors on the IV and TFA Content
The five hydrogenation factors, including temperature, H2 pressure, agitation, catalyst dose and hydrogenation time exhibited remarkable effect on the IV and TFA content of hydrogenated SFO on Pd–B/γ–Al2O3 catalyst. Both temperature and H2pressure have significant effects on hydrogenation conversion and Si because of their effect on IV decrease and TFA formation. A maximum IV decrease was observed with increase in both temperature and the H2 gas pressure. An increase in hydrogenation temperature sped up the hydrogenation reaction,8and then a quick consumption of H2 on the catalyst surface took place accordingly. However, an increase in H2 gas pressure offsets the utilized H2 gas and leads to maximumdecline in IV, as shown in Fig.3 (a) where the maximum IV decrease was associated with maximum temperature and pressure.This result was consistent with what has been stated by.13On the other hand, TFA formation was found to be increased by hydrogenation temperature while the increase in H2 gas pressure diminished this effect in which the combined impact of high temperature and pressure leads to moderate formation of TFAs as shown in Fig.3 (b). This interpretation was consistent with the observations of.13
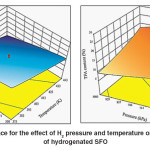 |
Fig. 3: Response surface for the effect of H2 pressure and temperature on (a) IV (b) TFA content of hydrogenated SFO Click here to View figure |
Similar results were found for the combined effect of hydrogenation temperature and agitation as shown in Fig.4 (a) and (b), where an increase in temperature leads to increase the catalyst activity which in turn leads to increase the rate of H2 consumption for the saturation reaction. Parallel to that, agitation capable to provide an additional quantity of H2 gas to the catalyst surface to meet the growing which needs to offsetthe high H2consumption resultedfrom the effect of high temperature. This phenomenon of high temperature and agitation leads to maximum IV decline as well as a moderate TFA formation. In other words, hydrogenation of SFO at maximum temperature and agitation values followed in this study leads for higher conversion and moderate Si. These results agreed well with the observation of Abdullinaet al.6
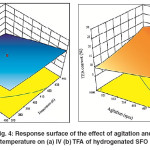 |
Fig. 4: Response surface of the effect of agitation and temperature on (a) IV (b) TFA of hydrogenated SFO Click here to View figure |
Increase in catalyst concentration leads to increase concentration of active sites, which seek for more H2 and triglycerides for adsorption and then chemical reaction. If there was a sufficient amount of H2 on the catalyst surface, the IV decline could be achieved and reached its maximum value. By contrast, if the H2 concentration was not sufficient, an increase in catalyst active site concentration generates a scarcity in H2 concentration on the catalyst surface which leads for increasing the tendency to form TFAs. However, the combined effect of high temperature and high catalyst dose leads to accelerate the hydrogenation reaction, increase the IV decline and increase in H2 consumption on the catalyst surface. As a result, H2 scarcity is increased and sped up the tendency of the catalyst to form TFAs. Thereby, the maximum temperature and catalyst dose lead for maximum IV decline and TFA formation as shown in Fig.5 (a) and 5 (b). These results wereagreed with the findings of Deliy et al.and O’Brien7, 8.
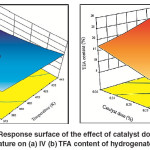 |
Fig. 5: Response surface of the effect of catalyst dose and temperature on (a) IV (b) TFA content of hydrogenated SFO Click here to View figure |
The period of reaction has a noticeable effect on both extent of IV decline and TFA content in hydrogenated SFO on Pd–B/γ–Al2O3 catalyst as shown in Fig.6 (a) and 6 (b). Increase the reaction time leads to increase in the chances of meeting the reactants together. The long reaction time also gives enough time for reactants transportation towards the catalyst active sites. Furthermore, the depletion rate of reactants increased over time, thus affecting the rate of hydrogenation and isomerization in which consistent with the findings of Belkacemi et al. and Gabrovska et al. 24, 25 The progress of C = C double bonds saturation leads for an accumulationfor IV decline which is normally associated with the TFA formation.26, 27Then, the combined effect of long reaction time and high temperature leads to maximum IV decline and maximum TFA formation.
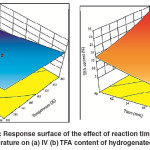 |
Fig. 6: Response surface of the effect of reaction time and temperature on (a) IV (b) TFA content of hydrogenated SFO Click here to View figure |
H2 pressure and agitation rate are the tools of increasing the H2 solubility in the SFO which in turn accelerates the transportation towards catalyst and then leads to increase its concentration on the Pd–B/γ–Al2O3 catalyst surface. Thereby, increasing the value of both factors promotes C = C double bond hydrogenation reaction over trans–isomerization. In addition, the abundance of H2 concentration on the catalyst surface leads to an increase in hydrogenation conversion (increases the IV decline) as well as decrease in trans–isomerization.13Thereby, a combined increase in H2 pressure and agitation rate is noticeably affected both IV decline and TFA content formation. Fig.7 (a) and 7 (b) show that the maximum IV decline and minimum TFA formation were associated with maximum H2 pressure and agitation rate. These results are agreed with the comments and observations of Abdullina et al., McArdle et al., Singh et al. and Deliy et al.6, 8, 10,
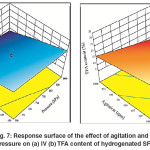 |
Fig. 7: Response surface of the effect of agitation and H2 pressure on (a) IV (b) TFA content of hydrogenated SFO Click here to View figure |
An increase in the Pd–B/γ–Al2O3 catalyst dose implies increased the area of active sites which requires increasing the H2 concentration on the catalyst surface to achieve the required conversion. So, if the H2 concentration is not sufficient to meet the requirements of the increase in the area of active sites, the active sites will tend fortrans-isomerization over hydrogenation. A synergetic effect of catalyst dose and H2 pressure on IV decline of hydrogenated SFO was noticeably observed as shown in Fig. 8 (a), where an increase in the values of both factors caused the maximum IV decline. An increase in the catalyst dose provides the hydrogenation medium with additional Pd–B active sites. However, a combined increase in catalyst dose and H2 pressure provides these active sites with better opportunities to saturate the C = C double bonds and then to decline the IV of the oil subjected to hydrogenation. On the other hand, minimum TFA content was achieved by a maximum increase in H2 pressure and using the minimum catalyst dose of the range for this study as shown in Fig. 8 (b). This effect was attributed to the role of H2 pressure on the orientation of the reaction towards hydrogenation over trans–isomerization.
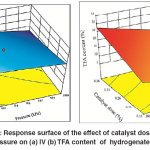 |
Fig. 8: Response surface of the effect of catalyst dose and H2 pressure on (a) IV (b) TFA content of hydrogenated SFO Click here to View figure |
As previously mentioned, IV decline was found to increase with the time of SFO hydrogenation, whichwas attributed to a decrease in the concentration of the unsaturated double bonds as the reaction progress. It was also mentioned that an increase in the H2 pressure leads to increase the IV decline. The combined effect of time and H2 pressure was remarkably affected the IV of the hydrogenated SFO where the maximum IV decline (maximum conversion) was associated with maximum time and pressure as shown in Fig.9 (a). However, the formation of TFAs was noticeably increased with hydrogenation time, but reduced with increase in H2 pressure. The combined effect of time and H2 pressure produces moderate content of TFAs at the maximum values of both reaction time and H2pressure [Fig.9(b)]. However, the minimum TFA formation was associated with minimum time and maximum H2 pressure used in this study.
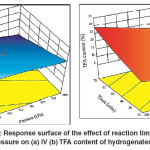 |
Fig. 9: Response surface of the effect of reaction time and H2 pressure on (a) IV (b) TFA content of hydrogenated SFO Click here to View figure |
Similar results were obtained for the combined effect of the time and catalyst dose, where the maximum decline in the IV was observed at the maximum hydrogenation time and catalyst dose as shown in Fig. 10 (a). This effect was attributed to the increase in both reaction time and catalyst active site which increased the saturation of the double bonds. By contrast, an increase in both factors led to an increase in TFA content of the hydrogenated SFO. However, minimum TFA content was associated with minimum reaction time and catalyst dose as shown in Fig.10 (b). Furthermore, it was observed that moderate TFA content was formed either by minimum reaction time and maximum catalyst dose or vice versa. The moderate TFA content was corresponding to moderate IV of hydrogenated SFO. This observation was noticeably consisted with the findings of Numwong et al. and Nikolaou et al.26, 27 related the association of saturation with TFA formation during hydrogenation of fatty acid methyl esters.
fig10
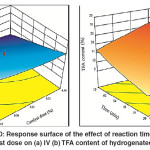 |
Fig. 10: Response surface of the effect of reaction time and catalyst dose on (a) IV (b) TFA content of hydrogenated SFO Click here to View figure |
Optimization of SFO Hydrogenation on Pd-B/γ-Al2O3Catalysts
Statistical DOE was used to determine the region in the values of hydrogenation factors (temperature, pressure, agitation, catalyst dose and hydrogenation time) that leads to the best possible response [IV of 70 (g I.(100 g SFO)-1 as well as minimum TFA content]. These responses correspond to a 44 wt.% conversion and minimum Si. The constraints which were considered for each factor and response are shown in Table 7.
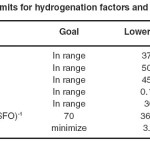 |
Table 7: Limits for hydrogenation factors and responses Click here to View table |
The DOE suggested 63 different solutions, with 4 solutions having the highest desirability (0.942) as shown in Table 8. The first solution was selected because of the lower catalyst dose and lower TFA content.
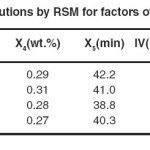 |
Table 8: Suggested solutions by RSM for factors of hydrogenation of SFO Click here to View table |
Evaluation of the first solution was performed by SFO hydrogenation the Pd–B/γ–Al2O3 catalyst under the conditions mentioned in Table 8. The aim was to determine the IV and TFA content of the HSFO under these conditions. The results were that the IV was declined from 125 to 72.5 ( g iodine per 100 g SFO) and the TFA content was 10.6 %. These results were corresponding to 42 % conversion and 0.25 trans-isomerization selectivity.
CONCLUSION
Statistical analysis was performed on sunflower oil hydrogenation process factors using Pd–B/γ–Al2O3 catalyst. Each factor was found to have remarkable effect on the iodine value and trans fatty acid content of hydrogenated sunflower oil. Optimization study was performed on the hydrogenation factors to achieve the required iodine value and minimum trans fatty acid content.
REFERENCES
- Piqueras, C., Tonetto, G., Bottini, S. and Damiani, D.,Catal. Today, 133: 836-841, (2005).
- Schaaf, T.and Greven, H., Lipid Tech.,22 (2): 31-35 (2010).
- Singh, D., Rezac, M. andPfromm, P. J. Am. Oil Chem. Soc., 86 (1), 93-101 (2009).
- U.S. Census Bureau, Fats and oils production, consumption, and stocks-2007, Current industrial reports M311K (07)-13 (2008).
- Bouriazos, A., Mouraditis, K., Psaroudakis, N. and Papadogianakis, G.,Catal. Lett., 121: 158 164 (2008).
- Abdullina, R., Voropaev, I., Romanenko, A., Chumachenko, A., Noskov, A.,and Mashnin A., Russ. J. Appl. Chem., 5 (4): 463-467 (2012).
- O’Brien, R.D. Fats and oils : formulating and processing for applications, 3rded,Taylor & Francis Group, USA (2009).
- Deliy, I., Simakova, I., Ravasio, N., and Psaro, R., Appl. Catal., A., 357 (2): 170-177 (2009).
- Cepeda, E. and Calvo, B., J. Food Eng., 89 (4): 370–374 (2008).
- McArdle, S., Girish, S., Leahy, J., and Curtin, T.,J. Mol. Catal. A: Chem., 351: 179-187 (2011).
- Tonetto, G., Jhon, F., Sanchez, J., Ferreira, M. and Daniel, D.,J. Mol. Catal. A: Chem., 299 (1-2):88-92 (2009).
- Fernandez, M., Piqueras, C., Tonetto, G., Crapiste, G. and Damiani, D., J. Mol. Catal. A: Chem., 233 (1-2): 133-139 (2005).
- McArdle, S., Curtin, T. and Leahy, J., Appl. Catal., A.,382 (2):332–338 (2010).
- Gebauer, S., Chardigny, J., Jakobsen, M., Lamarche, B., Lock, A., Proctor, S. and Baer, D., Adv. Nutr.,2: 332–354(2011).
- Mozaffarian, D., Katan, M., Ascherio, A., Stampfer, M. and Willett, W.,N. Engl. J. Med., 354: 1601–1613(2006).
- Wu, J., Wang, J., Li, M., Lin, J. and Wei, D., Bioresour. Technol., 101 (23): 8936-8941 (2010).
- Andrade, G., Rocha Filho, G., Taqueda, M., Braz. J. Chem. Eng., 5 (1):51–58 (1998).
- Alshaibani, A., Yaakob1, Z., Alsobaai, A., and Sahri, M., Rasayan J.Chem., 5 (4): 463 – 467 (2012).
- Vicente, G., Martinez,M. and Aracil, J.,Bioresour. Technol., 98 (9): 1724–1733 (2007).
- AOCS. Official methods and recommended practices of the AOCS, 6thed.,AOCS Press, Champaign, Illinois, (2011).
- Lausche, A., Okada, K. and Thompson, L., Electrochem. Commun., 15 (1): 46-49 (2012).
- Zabeti, M., Wan Daud , W. and Aroua, M., Appl. Catal., A.366 (1): 154–159 (2009).
- Kohli, A. and Singh, H.,Sadhana, 36 (2): 141–152 (2011).
- Belkacemi, K., Kemache, N., Hamoudi, S. and J. Arul, J., Int. J. Chem. React. Eng., 5 (1): 1- 25 (2007)
- Gabrovska, M., Krstic, J., Edreva–Kardjieva, R., Stankovic, M. and Jovanovic, D.,Appl. Catal., A.,299: 73–83 (2006).
- Numwong, N., Luengnaruemitchai, A., Chollacoop, N. and Yoshimura, Y., Chem. Eng. J. 210: 173–181 (2012).
- Nikolaou, N., Papadopoulos, C., Lazaridou, A., Koutsoumba, A., Bouriazos, A. and Papadogianakis, G.,Catal. Commun, 10 (5): 451–455 (2009).
- Singh, D., Pfromm, P. and Rezac, M., AIChE J., 57 (9): 2450–2457 (2011).


![]()


