Graphene for Preconcentration of Trace Amounts of Ni in Water and Paraffin-Embedded Tissues from Liver Loggerhead Turtles Specimens Prior to flame Atomic Absorption Spectrometry
Hanie Arbabi Rashid1, Ali Moghimi1*
Department of Chemistry, Varamin(Pishva) Branch Islamic Azad University, Varamin, Iran
DOI : http://dx.doi.org/10.13005/ojc/300140
Article Received on :
Article Accepted on :
Article Published : 02 Apr 2014
A new sensitive and simple method was developed for the preconcentration of trace amounts of Ni using 1-(2-pyridylazo)-2-naphthol (PAN) as chelating reagent prior to its determination by flame atomic absorption spectrometry. The proposed method is based on the uti- lization of a column packed with graphene as sorbent. Several effective parameters on the extraction and complex formation were selected and optimized. Under optimum conditions, the calibration graph was linear in the concentration range of 5.0–240.0 µg L-1 with a detection limit of 0.36 µg L-1. The relative standard deviation for ten replicate measurements of 20.0 and 100.0 µg L-1 of Ni were 3.45 and 3.18%, respectively. Comparative studies showed that graphene is superior to other adsorbents including C18 silica, graphitic carbon, and single- and multi-walled carbon nanotubes for the extraction of Ni. In the present study, we report the application of preconcentration techniques still continues increasingly for trace metal determinations by flame atomic absorption spectrometry (FAAS) for quantification of Ni in Formalin-fixed paraffin-embedded (FFPE) tissues from Liver loggerhead turtles. The proposed method was successfully applied in the analysis of four real environmental water samples. Good spiked recoveries over the range of 95.8–102.6% were obtained.
KEYWORDS:Graphene; Solid-phase extraction; Preconcentration;Flame atomic absorption spectrometry; Formalin-fixed paraffin-embedded (FFPE) ; tissues from Liver loggerhead turtles;Ni
Download this article as:| Copy the following to cite this article: Rashid A. H, Moghimi A. Graphene for Preconcentration of Trace Amounts of Ni in Water and Paraffin-Embedded Tissues from Liver Loggerhead Turtles Specimens Prior to flame Atomic Absorption Spectrometry. Orient J Chem 2014;30(1). |
| Copy the following to cite this URL: Rashid A. H, Moghimi A. Graphene for Preconcentration of Trace Amounts of Ni in Water and Paraffin-Embedded Tissues from Liver Loggerhead Turtles Specimens Prior to flame Atomic Absorption Spectrometry. Orient J Chem 2014;30(1). Available from: http://www.orientjchem.org/?p=2428 |
Introduction
Ni at trace concentrations acts as both a micronutrient and a toxicant in marine and fresh water systems (Izatt et al,1991; Izatt et al,1985; Izatt et al,1995; Blake et al,1996; Arca et al,2001; Ghoulipour et al,2002; Hashemi et al,2001; Shcherbinina et al,1990).This element is needed by plants at only very low levels and is toxic at higher levels. At these levels, Ni can bind to the cell membrane and hinder the transport process through the cell wall. Ni at nearly 40ng mL-1 is required for normal metabolism of many living organisms (Gomes-Gomes 1995; Unger et al, 1979). On the other hand, Ni is an important element in many industries. Thus, the development of new methods for selective separation, concentration and determination of it in sub-micro levels in different industrial, medicinal and environmental samples is of continuing interest. The determination of Ni is usually carried out by flame and graphite furnace atomic absorption spectrometry (AAS) . (Boudreau et al, 1989 ) as well as spectrometric methods (Bruening et al,1991; Mahmoud and Soliman,1997 a) . Solid phase extraction (SPE) methods are the best alternatives for traditional classic methods due to selective removal of trace amounts of metal ions from their matrices. Solid phase extraction determinations can be carried out on different efficient ways. One of the most appropriative performation features of SPE is achieved by using octadecyl silica membrane disks. SPE reduce the use of toxic solvent, disposal costs, and extraction time(Mahmoud et al, 1997 b,45; Mahmoud et al, 1997b).The octadecyl silica membrane disks involves shorter sample processing time and decreased plugging due to the large cross-sectional area of the disk and small pressure drop which allows higher flow-rates; reduced channeling resulting from the use of sorbent with smaller particle size and a greater mechanical stability of the sorbent bed(Tong et al,1990). In our previous attempts, we modified SPE membrane disks with suitable compounds for selective determination of chromium(Dadler et al,1987; Moghimi 2007) and lead(Mahmoud et al,1990).Meanwhile, other investigators have successfully utilized these sorbents for quantitative extraction and monitoring trace amounts of lead(Leyden et al,1976; Moghimi et al,2009; Liu et al,1992), copper (Liu et al,1996; Mishenina et al,1996; Wang et al,1999), silver( Wanget al,1997; Zhang et al,1982), mercury (Zhouet al,1983; Zargaran et al, 2008), cadmium (Tabarzadi et al, 2010) , palladium (Shin et al, 2004) , Ni(Moghimi et al,2012) and UO2 (Mahmoudet al,1998 ;Moghimi et al,2006). To ease the retrieval procedure, the SPE using graphene as the absorbent in a column combined with flame atomic absorption spectrometry (FAAS) has been demonstrated by our research group (Wang et al., 2012). We extend its applica- tion to other inorganic analyses. 1-(2-Pyridylazo)-2-naphthol (PAN), a chelating agent which forms stable complexes with a number of metals and has found numerous applications in trace element separation and pre-concentration methods (Narin and Soylak., 2003; Shokoufi et al., 2007), was used to extract Co (structure of the Ni-PAN complex is shown in Fig. 1). What is more, it possesses a benzene ring structure. Based on this, the Ni-PAN is considered to have formed a strong p-stacking interaction with graphene when the sample solution passes through the column during which the Ni- chelate is retained. The factors influencing the efficiency of SPE and FAAS determination were systematically studied. The proposed method has been applied for the determination of trace amounts of Ni in water samples with satisfactory re- sults. It reveals great potential of graphene as an excellent sor- bent material in analytical processes for metal ions once again.
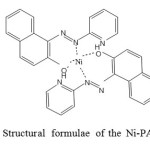 |
Figure 1 Structural formulae of the Ni-PAN complex. Click here to View Figure |
of trace amounts of Ni in water samples with satisfactory re- sults. It reveals great potential of graphene as an excellent sor- bent material in analytical processes for metal ions once again.
Methods
Apparatus
A Shimadzu (Kyoto, Japan) Model AA-6300C atomic absorp- tion spectrometer equipped with deuterium background correction and a Ni hollow-cathode lamp as the radiation source were used for absorbance measurements at a wavelength of 240.7 nm. All measurements were carried out in an air/acetylene flame. The instrumental parameters were adjusted according to the manufacturer’s recommendations. A pH3-3C digital pH meter equipped with a combined glass–calomel electrode (Hangzhou Dongxing Instrument Factory, Hangzhou, China) was used for pH adjustment. The SPE experiments were performed on an Agilent vacuum manifold processing station with a Gast vacuum pump (Tegent Technology Ltd. Shanghai, China). The empty SPE columns (3.0 mL) and SPE frits were purchased from Agilent.
Reagents and materials
Graphite powder (50 mesh), potassium permanganate (KMnO4), concentrated sulfuric acid (H2SO4), and sodium ni- trate (NaNO3) were purchased from Tianjin Tianda Chemical Reagent Company (Tianjin, China). A stock standard solution of Ni at a concentration of 1000 µg mL-1 was purchased from the National Institute of Standards (Beijing, China). Working standard solutions were prepared daily through serial dilutions of the stock solution with deionized water prior to analysis. The chelating agent, 2.0 g L-1 PAN solution, was prepared by dissolving the appropriate amount of PAN (Shanghai Chemistry Reagent Company, Shanghai, China) in absolute ethanol. Stock solution of diverse elements was prepared from high purity compounds. Single-walled CNTs (SWCNTs, car- bon purity >90%, outer diameter <2 nm, length 5–15 µm) and multi-walled CNTs (MWCNTs, carbon purity >98%, outer diameter 20–40 nm, length 5–15 µm) were obtained from the Beijing Chemistry Reagent Company (Beijing, China).
Nitric acid (0.1 mol L-1) was used to adjust the pH in the 2–3 range, and ammonium acetate buffers (0.2 mol L-1) were prepared by adding an appropriate amount of acetic acid to ammonium acetate solutions resulting in solutions with a pH range of 4.0–5.0. For a pH range of 6.0–8.0, a phosphate buf- fer solution (0.2 mol L-1) was prepared by adding an appro- priate amount of disodium hydrogen phosphate to sodium dihydrogen phosphate. Ammonium chloride buffer solutions (0.2 mol L-1) were prepared by adding an appropriate amount of ammonia to ammonium chloride solutions, resulting in solutions with a pH range of 9.0–10.0. All reagents used were of analytical reagent grade. Deion- ized water was used in the preparation of all solutions. All glassware and columns were kept in 10% nitric acid for at least 24 h and subsequently washed four times with deionized water before application.
Synthesis and characterization of graphene
Graphene nanoparticles were synthesized according to our previously reported study (Wang et al., 2012). The size and morphology of G was observed by scanning electron micros- copy (SEM) using an S-3000N microscope and X-ray diffrac- tion (XRD) measurement was carried out using a Rigaku D/ max-rB diffractometer with Cu Ka radiation. In Fig. 2a, the SEM image shows the graphene agglomerate, consisting of al- most transparent carbon nanosheets with thin wrinkled and silk-like structures. XRD patterns in Fig. 2b reveal that the graphene nanosheets’ peak at 2h = 26.2°, which is the charac- teristic peak of graphene (Rao et al., 2009).
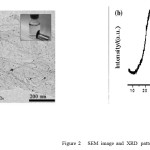 |
Figure:2 SEM image and XRD pattern. |
Column preparation
Graphene (30.0 mg) was placed in a 3.0 mL SPE column using an upper frit and a lower frit to avoid adsorbent loss. Prior to extraction, the column was preconditioned with 10.0 mL meth- anol and 10.0 mL deionized water, respectively. The column was then conditioned to the desired pH with 5.0 mL of 0.2 mol L-1 acetate buffer solution.
Recommended procedure
100.0 mL of the sample solution containing 100.0 µg L-1 of Ni was prepared. 2.5 mL of PAN (2.0 g L-1) solution was added and the pH value was adjusted to 5.0 with acetate buffer solu- tion. The resulting sample solution was passed through the col- umn at a flow rate of 2.0 mL min-1. After the solution passed through it completely, the column was rinsed with 5.0 mL of deionised water, and the analytes retained on the column were eluted with 2.0 mL of 2.0 mol L-1 HNO3 in methanol at a flow volume, 2.5 mL; eluent type, 2.0 M HNO3 in methanol; eluent 1; flow rates of rate of 2.0 mL min-1. The analyte ions in the eluent were volume, 2.0 mL; concentration of Ni, 100.0 µg.L-1 determined by FAAS. A blank was always taken through the whole procedure.
Sampling
Tap, sea, and river water samples used for the development of the method were collected in polytetrafluoroethylene (PTFE) containers from the Hebei Province. Before the anal- ysis, the organic content of the water samples was oxidized in the presence of 1% H2O2 and then concentrated nitric acid was added. These water samples were then filtered using a 0.45 lm pore size membrane filter to remove suspended par- ticulate matter and stored in a refrigerator in the dark before analysis.
Analysis of sample paraffin-embedded tissues from liver loggerhead turtles
specimens: Selected areas from fresh frozen tissues from liver loggerhead turtles specimens were sliced in three pieces (numbered as 1, 2 and 3) of approximately 10 mm × 5 mm × 2 mm each. Sets of pieces of set 1 (controls), were placed into a vacuum chamber at 50 ºC overnight to dry (until a constant weight was obtained) and the sets 2 and 3 were subjected to the standard 10 % buffered formalin fixation and paraffin embedding31 histological process using a tissue processor (Tissue-Tek VIP, Sakura Finetek USA Inc., Torrance, CA). After the paraffin embedding process, tissues were subsequently excised from the blocks with a titanium knife and deparaffinized in xylene at 55 ºC for 1 h in the tissue processor (the set 2), or with hexane at 20 ºC for 1 week with frequent changes of the solvent in handling-based procedure (the set 3). Xylene was of a grade routinely used for the FFPE process and hexane was of ”Optima” grade (Fisher Scientific). Upon deparaffinization, the tissue samples were dried in a vacuum chamber until constant weight was obtained. Each dried sample (of the sets 1-3) was divided into three portions (5-10 mg each) to be further analyzed as triplicates.
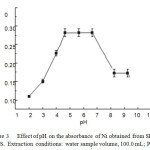 |
Figure: 3 Effect of pH on the absorbance of Ni obtained from SPE- FAAS. Extraction conditions: water sample volume, 100.0 mL; PAN Click here to View Figure |
Results and discussion
Effect of pH
Sample pH had a critical effect on the adsorption of target compounds by affecting the existing form of target com- pounds, the charge species and density on the sorbents surface (Jiao et al., 2012). A series of experiments was performed by adjusting the pH from 2.0 to 10.0 with nitric acid, ammonium acetate, phosphate and ammonium chloride. The results illus- trated in Fig. 3 reveals that the absorbance is nearly constant in the pH range of 5.0–7.0. The progressive decrease in the extraction of Ni at low pH is due to the competition of the hydrogen ion with the analyte for the reaction with PAN. Accordingly, pH 5.0 was selected for subsequent work and real sample analysis.
Influence of the amount of PAN
The effect of the amount of PAN on the absorption was stud- ied using various volumes of the reagent ranging from 0.5 mL to 3.5 mL. The signal of Ni was increased with the increase of PAN volume up to 2.0 mL, and then kept constant. Hence, 2.5 mL of 2.0 g L-1 PAN solution was chosen to account for other extractable species that might potentially interfere with the assaying of Ni. sample and eluent solution, 2.0 mL min-1
Effect of flow rates of sample and eluent solution
The efficiency of metal preconcentration essentially depends on the flow rate of the sample solution to pass through the micro- column, whereas the flow of eluent solutions affects the recov- eries. The time taken is also a considerable factor. Therefore, the effect of the flow rate of the sample and eluent solutions on the recoveries of Ni on graphene was examined in the range of 0.5–5.0 mL min-1. The flow rate of the sample and eluent solutions had no obvious influence on the quantitative recover- ies of analytes at the range of 0.5–4.0 and 0.5–2.0 mL min-1, respectively. A 2.0 mL min-1 flow rate of the sample and eluent solutions was chosen in subsequent experiments.
Breakthrough volume
The measurement of breakthrough volume is important in so- lid phase extraction because breakthrough volume represents the sample volume that can be preconcentrated without the loss of analyte during elution of the sample (Mester and Stur- geon, 2003). The breakthrough volume of the sample solution was tested by dissolving 10.0 µg of Ni in different volumes (25.0–1000.0 mL) and the recommended procedure was fol- lowed. It was observed that Ni was quantitatively recovered when the sample volume was less than 400.0 mL. When the sample volume exceeded 400.0 mL, the recovery was de- creased. The preconcentration factor for preconcentration and extraction is calculated by the ratio of the highest sample volume for analyte (400.0 mL) and the lowest final eluent vol- ume (2.0 mL). In the present study the possible preconcentra- tion factor was 200.
Adsorption capacity
In order to evaluate the adsorptive capacity of graphene, a batch method was used. 100.0 mL of solution containing 1.0 mg of metal ion at pH 5.0 was added to 30.0 mg sorbent. The mixture was filtered, after shaking for 10 min. 10.0 mL of the supernatant solution was determined by FAAS. The capacity of the sorbent for Ni was found to be 20.6 mg g-1.
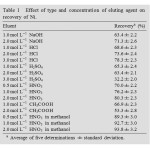 |
Table1: Effect of type and concentration of eluting agent on recovery of Ni. Click here to View table |
Eluent type and its volume
In order to choose the best solvent for desorption of the ad- sorbed analytes on graphene, many reagent solutions were investigated. The results were given in Table 1. As can be seen, the recoveries of Ni were not so satisfactory when HCl, HNO3, H2SO4, CH3COOH and NaOH were used as eluents solely. Good quantitative recovery for analyte ions could be obtained with 2.0 mol L-1 HNO3 in methanol. The effect of eluent volume on the recovery of Ni was also studied by using 2.0 mol L-1 HNO3 in methanol; it was found that quantitative recoveries could be obtained with 2.0–4.0 mL of 2.0 mol L-1
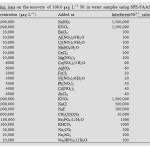 |
Table 2: Effect of interfering ions on the recovery of 100.0 µg L-1 Ni in water samples using SPE-FAAS. Click here to View table |
Table 3. Analytical results of Ni determination (dissolved fraction) in certified reference materials and spiked natural water samples with the SPE-FAAS method (n = 3).
| Table 3. Analytical results of Ni determination (dissolved fraction) in certified reference materials and spiked natural water samples with the SPE-FAAS method (n = 3). | |||
| Sample | Ni 2+ added (µg) | Ni 2+determined(ng.mL-1) | ICP-AES |
| GSBZ 50,030-94 (µg L-1) | 0.0 | 28.53 (2.0) | 28.20(2.0) |
| Tap water(Tehran, 20January, 2014) | 0.010.0 | 1.74(2.0)a11.95(2.6) | NDb11.6 |
| Snow water(Tehran , 5 February ,2014) | 0.010.0 | 4.84(2.1)14.96(2.4) | ND14.6 |
| Rain water (Tehran, 20 January, 2013) | 0.010.0 | 2.65(2.3)12.46(2.3) | ND12.3 |
| Sea Water Tehran , 16 February ,2013) | 0.010.0 | 12.65(2.4)22.96(2.0) | 12.423.1 |
| Development of a methodology for the determination of Ni 2+ in FFPE tissue | 0.010.0 | N.Db9.95(2.2) | N.Db10.05(2.5) |
| a Values in parentheses are %RSDs based on five individual replicate analysisb Not detected. | |||
5.0 to 240.0 µg L-1 for Ni. The calibration equation is A = 3.16 · 10-3C + 0.0042 with a correlation coefficient of 0.9992, where A is the atomic absorbance of Ni, obtained by peak height, in the eluent at 240.5 nm and C is its concentra- tion in the sample solution (µg L-1). The limits of detection and quantification defined as 3SB/m and 10SB/m (where SB is standard deviation of the blank and m is the slope of the cal- ibration graph) were 0.36 and 1.20 µg L-1, respectively. The relative standard deviation (RSD) for ten replicate measure- ments of 20.0 and 100.0 µg L-1 of Ni were 3.45% and 3.18%, respectively.
Analytical application
The proposed method was used for the determination of Ni in several water samples. The results, along with the recovery for the spiked samples, are given in Table 3. The recoveries for the addition of different concentrations of Ni to water samples were in the range of 95.8–97.6%. To verify the accuracy of the proposed procedure, the method was used to determine of the content of Ni in the National Standard Reference Mate- rial for Environment Water (GSBZ 50030-94) after the appro- priate dilution and development of a methodology for the determination of Ni 2+ in FFPE tissue . The results for this test are presented in Table 3. A good agreement between the determined values and the certified values was obtained.
Comparison with other sorbent materials
In this work, we report a comparison between graphene with several commonly used reserved-phase sorbent materials including C18 silica, graphitic carbon, and CNTs. For this purpose, the same amount (30.0 mg) of different adsorbents was packed in 3.0 mL SPE columns. The columns were loaded with 100.0 mL of sample solutions containing 100.0 µg L-1 of Ni. All the work is done under the optimized conditions of graphene selected above. The C18 silica was evacuated from a Supelclean LC-18 SPE tube (Shanghai Chuding Instrument Company, Shanghai, China). The Ni in the flow-through, washing solution, and eluate were all determined. As shown in Table 4, the graphene-packed column yields the highest recoveries (96.2%) among the studied adsorbents. This result definitely justifies the worth of graphene as an SPE adsorbent. Ni could be detected in the flow-through and washing solution after loading on a C18 column, indicat- ing that 30.0 mg C18 silica is insufficient for the retention of chelates. To obtain acceptable results with C18, more adsor- bent should be packed in the column to enhance the adsorp- tion capacity. For instance, with a C18 column packed with 300.0 mg C18 silica, the recoveries of Ni can reach 93.5%. However, increasing the adsorbent amount will add to the cost of analysis and is unfavorable for instrument miniaturization. Graphitic carbon performed even more poorly than C18. It was proposed that graphitic carbon did not give the expected extraction efficiency because of its large size and blank volume and less active sites for adsorption (Zhou et al., 2006). So it is noted that adsorption capacity of the adsorbents was generally in the following order: Graphene >C18 silica >Graphitic car- bon. For MWCNTs, the recovery was approximately 78.3%, which is evidently inferior to that of graphene. Recoveries for columns using SWCNTs were higher than MWCNTs, but still inferior to graphene. No Ni was present in the flow- throughs and washing solutions for MWCNTs and SWCNTs, indicating that CNTs also have good sorption capacities for Ni. Thus, the lower recoveries on CNTs should be ascribed to extremely stable adsorption and incomplete elution. Increasing the volume of the eluent solvent can improve the recovery, e.g., with 5.0 mL HNO3 as eluent solvent, the recov- ery of Ni on SWCNT column can reach 92.3%. Nevertheless, increasing the volume of the eluent solvent will reduce the pre- concentration factor. The advantage of graphene over C18 and graphitic carbon mainly lies in its higher sorption capacity. In addition, com- pared with CNTs, achieving complete elution with graphene is more facile. The above experimental results indicated that graphene is a very promising adsorbent material.
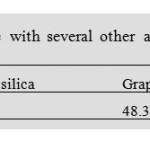 |
Table 4 Comparison of the performance of graphene with several other adsorbents (C18 silica, graphitic carbon, SWCNTs, and MWCNTs) for the SPE of Ni. Click here to View table |
conclusions
In conclusion, the proposed method reveals the great potential of graphene as an advantageous sorbent material in SPE. Using Ni as model analyte, the graphene-packed SPE columns showed reliable and attractive analytical performance in the analysis of environmental water samples. Higher recoveries were achieved with graphene than with other adsorbents including C18 silica, graphitic carbon, and CNTs, owing to the large surface area and unique chemical structure of graph- ene. Some other advantages of graphene as an SPE adsorbent have also been demonstrated, such as high sorption capacity, good reusability, and fine reproducibility. Although the ob- tained results of this research were related to the Ni determi- nation, the system could be a considerable potential guide for the preconcentration and determination of other metals.
Acknowledgements
The authour wish to thank the Chemistery Department of Varamin(Pishva) branch Islamic Azad University for financial support.
References
- Arca M., Blake A.J., Casab J., Demartin F., Devillanova F.A., Garau A., Isaia F., Lippolis V., Kivekas R., Muns V., Schroder M., Verani G., (2001)( Conformationally locked pentadentate macrocycles containing the 1,10-phenanthroline unit. Synthesis and crystal structure of 5-oxa-2,8-dithia[9](2,9)-1,10-phenanthrolinophane (L) and its coordination properties to Ni II, Pd II, Pt II, RhIII and Ru II ) J. Chem. Soc., Dalton Trans. 1180-1189.
- Blake A.J., Demartin F., Deviallonova F.A., Garau A., Isaia F., Lippolis V., Schroder M., Verani G. (1996), (Synthesis of dinuclear group 6 metal carbonyl complexes bridged by 4,4′-bipyrazole ligands )J. Chem. Soc., Dalton Trans.3705-3712.
- Ghoulipour V., Husain S.W. (2002), (studies on titanium(iv) tungstosilicate and titanium(iv) tungstophosphate. ii. separation and estimation of heavy metals from aquatic environments) Acta Chromatogr.12: 170-174.
- Gomes-Gomes M.M., Hidalgo Garcia M.M., Palacio Corvillo M.A. (1995) (On-line preconcentration of silver on a sulfhydryl cotton microcolumn and determination by flow injection atomic absorption spectrometry), Analyst120:1911-1916.
- Hashemi O. R ., Kargar-Razi M., Raoufi F., Moghimi A., Aghabozorg H., Ganjali M. R., (Ultra-trace monitoring of copper in environmental and biological samples by inductively coupled plasma atomic emission spectrometry after separation and preconcentration by using octadecyl silica membrane disks modified by a new schiff’s base) (2001)Microchem. J.69:1-8.
- Izatt R.M., Bradshaw J.S., Nielsen S.A., Lamb J.D., Christensen J.J. (1985)( This Week’s Citation Classic), D. Sen, Chem. Rev.85:271-277.
- Izatt R.M. , Pawlak K., Bradshaw J.S., Bruening R.L. (1991) (trans-Dichlorido(1,4,8,11-tetra¬azacyclo¬tetra¬deca¬ne)manganese(III) tetra¬fluorido¬borate), Chem. Rev.91:1721-1726.
- Izatt R.M., Pawlak K., Bradshaw J.S., Bruening R.L. (1995) (Self-Assembled Ionophores. An Isoguanosine-K+ Octamer), Chem. Rev.95:2529-2532.
- Jiao, Y.N., Ding, L., Fu, S.L., Zhu, S.H., Li, H., Wang, L.B., 2012.
- Determination of bisphenol A, bisphenol F and their diglycidyl ethers in environmental water by solid phase extraction using magnetic multiwalled carbon nanotubes followed by GC–MS/MS. Analytical Methods 4, 291–298.
- Mester, Z., Sturgeon, R., 2003. Sample Preparation for Trace Element Analysis. Elsevier, Amsterdam.
- Narin, I., Soylak, M., 2003. The uses of 1-(2-pyridylazo)-2-naphtol (PAN) impregnated Ambersorb 563 resin on the solid phase extraction of traces heavy metal ions and their determinations by atomic absorption spectrometry. Talanta 60, 215–221.
- Rao, C.N.R., Biswas, Kanishka, Subrahmanyam, K.S., Govindaraj, A., 2009. Graphene, the new nanocarbon. Journal of Materials Chemistry 19, 2457–2469.
- Shokoufi, N., Shemirani, F., Assadi, Y., 2007. Fiber optic-linear array detection spectrophotometry in combination with dispersive liquid–liquid microextraction for simultaneous preconcentration and determination of palladium and Ni. Analytica Chimica Acta 597, 349–356.
- Shcherbinina N.I., Myasoedova G.V., Khabazova T.A., Shroeva E.Y., Ishmiyarova G.R., Nikitina I.E., Bannykh L.N. (1990) (Preconcentration of trace amounts of silver ion in aqueous samples on octadecyl silica membrane disks modified with hexathia-18-crown-6 and its determination by atomic absorption spectrometry), Zh. Anal. Khim.45:2137-2141.
- Tong A., Akama Y., Tanaka S. (1990) (Sorption and preconcentration of some heavy metals by 2-mercaptobenzothiazole-clay), Anal. Chim. Acta 230: 179-185.
- Wang, Y.K., Gao, S.T., Zang, X.H., Li, J.C., Ma, J.J., 2012.
- Graphene-based solid-phase extraction combined with flame atomic absorption spectrometry for a sensitive determination of trace amounts of lead in environmental water and vegetable samples. Analytica Chimica Acta 716, 112–118.
- Zhou, Q.X., Wang, W.D., Xiao, J.P., Wang, J.H., Liu, G.G., Shi, Q.Z., Guo, G.L., 2006. Comparison of the enrichment efficiency of multiwalled carbon nanotubes, C18 silica, and activated carbon as the adsorbents for the solid phase extraction of atrazine and simazine in water samples. Microchimica Acta 152, 215–224.

This work is licensed under a Creative Commons Attribution 4.0 International License.
![]()
A New Edition of Web of Science
Journal Impact Factor
2022: 0.5
Five Year: 0.8
Journal is Indexed in

Cabells Whitelist
![]()


