Effluents quaity of woolen industrial units and efficiency of waste water treatment plant at Jorbir, Bikaner, Rajasthan (India)
Rajendra Singh1 Yogita yadav2
1Department of Chemistry , Ganpati Institute of Science Technology and Management, Jaipur,Rajasthan , India2 2Department of Chemistry, Banasthali University, Banasthali , Rajasthan, India
DOI : http://dx.doi.org/10.13005/ojc/300106
Article Received on : December 05, 2013
Article Accepted on : February 01, 2014
Article Published : 06 Feb 2014
Bikaner is one of the largest woolen scouring processing and industrial hub of the Asia. There are large no. Of woolen scouring and dying units in this city. However there are certain rules and regulations regarding the effluents expulsion and pollution control standards provided by national and international laws. The present work is an attempt for assessment of effluent and pollution parameters followed by woolen units as well as the efficiency of city waste water treatment plant. However subject is significantly related with public health , but the result s shows a poor performance and unawareness of state government.
KEYWORDS:Effluents; scouring; dying; efficiency; TDS; EC; chlorides; fluorides; nitrates; total hardness. BOD; TS; TSS; physiochemical parameters; drinking water quality etc. CPCB=Centralpollution control board india,
Download this article as:| Copy the following to cite this article: Singh R, yadav Y, .Effluents Quaity of Woolen Industrial Units and Efficiency of Wastewater Treatment Plant at Jorbir, Bikaner, Rajasthan (India). Orient J Chem 2014;30(1) |
| Copy the following to cite this URL: Singh R, yadav Y, .Effluents Quaity of Woolen Industrial Units and Efficiency of Wastewater Treatment Plant at Jorbir, Bikaner, Rajasthan (India). Orient J Chem 2014;30(1). Available from: http://www.orientjchem.org/?p=2033 |
Introduction
The woolen industry of Bikaner is known to be one of the oldest and most revenue generating economic activity. The woolen industrial market “mandi” of Bikaner which is the exclusive one in the entire Asia region in terms of size has made the place a famous carpet-weaving destination of Rajasthan. With this regard a separated carpet and textile industry zone is under establishment in Bikaner in RIICO karni industrial area, Bikaner.
Today, indicating economic self-sufficiency and employment scopes, the Bikaner Industries continue to grow beyond leaps and bounds. The fibers used in the woolen/carpet industry may be broadly classified into four groups: cotton, wool, regenerated and synthetics. The characteristic of the waste from the mill depends on the type of fiber and chemicals, dying used as different type of fibers and chemical go through being sent out of the mill. The pollutants are the waste water includes the natural impurities in the fibers used, and the processing chemicals The entire liquid waste from the Carpet and Wool Dying industry comes from the following operation of slashing (or sizing), scouring and desizing, bleaching, mercerizing, dying, and finishing. Enzymes are usually used in India to hydrolyze the starch; acids may also be used for this purpose. Caustic soda, soda ash, detergents etc re used in scouring in Kier boilers. Replacement of soap used in scouring by low BOD detergents may reduce BOD load by 35%. About 50% of the total pollution load of the mill is contributed by this section. Bleaching operations use oxidizing chemicals like peroxides and hypochlorite to remove natural coloring materials. This section contributes about 10% of the total pollution load. Mercerizing consists of passing the cloth/wool through 20% caustic soda solution. The process improves the strength, elasticity, luster and dye affinity. Waste from this section is recycled after sodium hydroxide recovery. Negligible waste which may come out of this section contributes little BOD but a high degree of alkalinity. Dying may be done in various ways, using different types of dyes and auxiliary chemicals. Classes of dye used include vat dyes, developing dyes, naphthol dyes, sulfur dyes, basic dyes, direct dyes etc. Some years ago, Govt. of india had handed over its responsibilities of implementation and monitoring of industrial effluent standards to the central pollution control board and related state pollution control board, whose prime aim is to promote the industries, not to penalize them for the cause of environmental pollution. However, this implementation and monitoring of standards given to cpcb has no longer effectives. In Bikaner, all most all water resources have turned to ecologically dead due to indiscriminate discharge of sewerage and other industrial effluents thought its stretch passing across the city. Moreover, the large fraction of number of industrial set up has been set up in Bikaner city. Among them, more than 40 percent of the industries are of water polluting nature and hence the overall industrial pollution in the Bikaner is even very high and more serious. . Most of these establishments are in the near by or attached public residential area. To address the pollution from the dying industries and domestic sewerage, five years back, a biological treatment plant has been constructed at Jorbir areain Bikaner, it has been said that this treatment plant is also not functioning well and expected results has not been achieved. So to address the issues of woolen industrial; pollution, Efficiency of treatment plant and compliance monitoring of some selected 10 wool Dying industries were aimed from this study.
TABLE 1.0 Water polluting Industries in Bikaner city-
| Locations | Total industries (2010) | Industries in Bikaner city | % of total Industry in city |
| Total industries | 4271 | 2174 | 50.9 |
| Water polluting industries | 1714 | 1241 | 72.4 |
| Woolen industries | 068(recognized) | 052(Non recognized) | |
| Ref.Source: State pollution controll board, dept. of industries Raj . Govt.2011-12 | |||
Experimental
Ten major woolen industries situated in different Industrial areas of Bikaner City were selected for the study purpose. Besides of these woolen industries the city waste water treatment plant was also selected and studied with
respect to analyse its treatment efficiency. Samples were duly collected and analysed with reference to using standard methods and tested against eight parameters in high quality laboratory during the period of Aug-2011 to JAN-2012. All the reagents were used of AR grade and glassware used of standard quality.
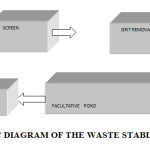 |
FIG.2.1 SCHEMATIC DIAGRAM OF THE WASTE STABLISATION POND STP BIKANER |
TABLE NO -2.0 List of Industries selected for compliance Study of Industrial Effluent Standards
| SAMPLE NO. | Name of Industry | Established | No. of employee | Current Production | Contact person and details | Consentstatus | |
| 1 | ARIHANT WOOL TEX[P] LTD | 1992 | 45 | 25 tons/month | Mr. Birendra Joshi ,manager | VALID | |
| 2 | ARORA TEXTILES | NA | 10 | 10 ton /month | Mr. Madan Sharma, Supervisor , | VALID | |
| SAMPLE NO. | Name of Industry | Established | No. of employee | Current Production | Contact person and details | Consentstatus | |
| 3 | BHAWANI WOOLTEXF | NA | 10-12 | 10 to 30 tons /month | Mr. Suman Das Rajbhandari, Incharge | VALID | |
| 4 | CHANDAK CARPETS | 1999 | 15 | 6 to 10 tons/month | Mr.Manoj Dhungana , | NOT APPLIED | |
| 5 | D.K. WOOLEN INDUSTRIES [P] LTD | NA | 15 | 8 to 10 tons/month | Mohan KC, | VALID | |
| 6 | DAULAT BIO FIBRE | NA | 16 | 12 tons/month | Mr.Deepak | PENDING | |
| 7 | INDIAN WOOLEN AND TEXTILE | NA | 18 | 15 tons/month | Mr. Raj Kumar YadavTel: …….. | PENDING | |
| 8 | SHAKTI SCOURING& MILLING MILL | 1986 | 6 | 2 tons/month | Mr. Chandra Kant Chaudhary | APPLIED | |
| 9 | SONA WOOLEN TEXTILE | NA | 5 | 1 ton/month | Mr. Om Prakash Gupta, Dye Master , | APPLIED | |
| 10 | SURANA WOOLEN TEXTILE | 1991 | 8 | 8 to 12 tons/month | Mr. Laxmi Gupta, Dye Master , | VALID | |
| Note: The raw wool were brought from Rajasthan,Tibet and Netherlands, Newziland, Australia.The chemicals basically Acetic Acid, LYOZEN SMK, Yellow 2GLN, Metal Complex and several dying etc has been used for dying.NA : Not Available | |||||||
Results and discussion
Tableno-3.0 Monitoring Result of Ten Wool Dying Industries effluent Load
| Parameters | Units | S1 | S2 | S3 | S4 | S5 | S6 | S7 | S8 | S9 | S10 | Govt Standard |
| Suspended Solids | mg/L | 66 | 52 | 258 | 310 | 6 | 38 | 68 | 48 | 348 | 9 | 100 |
| Biochemical Oxygen Demand (5 days at 200 C) | mg/L | 150 | 150 | 200 | 610 | 550 | 625 | 150 | 300 | 1750 | 40 | 100 |
| Oil and grease | mg/L | 102.8 | 65.80 | 107.8 | 38.8 | 60.80 | 74.80 | 66.80 | 22.40 | 190.6 | 19.80 | 10.00 |
| COD | mg/L | 300 | 375 | 425 | 1500 | 850 | 1000 | 212.5 | 400 | 2000 | 110 | 250 |
| Total Chromium (as Cr) | mg/L | 0.10 | 0.29 | 0.12 | 0.96 | 0.03 | 0.05 | 0.07 | 0.13 | 0.02 | 0.04 | 2.0 |
| Parameters | Units | S1 | S2 | S3 | S4 | S5 | S6 | S7 | S8 | S9 | S10 | Govt Standard |
| Sulphide (as S), | mg/L | 12 | 10 | 6 | 26 | 10 | 12 | 14 | 12 | 18 | 16 | 2.0 |
| Phenolic compounds (as C6 h5 OH) | mg/L | ND (<0.5) | ND (<0.5) | ND (<0.5) | ND (<0.5) | ND (<0.5) | ND (<0.5) | ND (<0.5) | ND (<0.5) | ND (<0.5) | ND (<0.5) 5 | 5.0 |
| pH Value | – | 7.2 | 7.56 | 6.66 | 11.17 | 4.61 | 4.47 | 3.71 | 6.75 | 4.45 | 7.05 | 5.5-9.0 |
TABLE NO-4.0 THE CHARACHTERSTICS OF A TYPICAL WOOLEN INDUSTRIAL EFFLUENT
| PH | 9.8-11.8 |
| Toal Alkalinity | 17.35mg/l asCaCo3 |
| BOD | 760 mg/l |
| COD | 1418mg/l |
| Total solid | 6170mg/l |
| Total Chromium | 12.5mg/l |
| Ref. CPCB.Newdelhi, Govt. of India,2010 | |
TABLE NO- 5.0 GOVT. POLUTION STANDARDS FOR WOOLEN INDUSTRIAL EFFLUENT :
| Characteristics | Tolerance Limit |
| Suspended Solids, mg/L | 100 |
| Biochemical Oxygen Demand (5 days at 200 C), mg/L | 100 |
| Oil and grease, mg/L | 10 |
| Chemical Oxygen Demand, mg/L | 250 |
| Total Chromium (as Cr), mg/L | 2 |
| Sulphide (as S), mg/L | 2 |
TABLE-6.0- EFFICIENY ANALYSIS OF THE JORBEER SEWARAGE TREATMENT PLANT.
| PARAMETERS | INFLOW03JAN,212.TIME-01.00 PMmg/l | OUTFLOW05 JAN,2012.TIME 6.00 PMmg/l | Standard(Part III: effluent standard from common treatment plants)mg/l | REMARK |
| Total Suspended solids, mg/L, Max | 928 | 544 | 50 | Not efficient |
| pH | 9.5 | 9.3 | 5.5-9.0 | No problem |
| Temperature (oC) | 18 | 15 | <40 oC | No problem |
| Biochemical oxygen demand (BOD) for 5 days at 20 degree C, mg/L, Max | 1150 | 440 | 50 | Not efficient |
| Oils and grease, mg/L, Max | 27.2 | 15.8 | 10 | Not efficient |
| Phenolic Compounds, mg/L, Max | ND (<0.5) | ND (<0.5) | 1 | No problem |
| Sulphides (as S), mg/L, Max | 12 | 8.2 | 2 | Not efficient |
| Total Residual chlorine, mg/L | 5.2 | 4.9 | 1 | Not efficient |
| Fluorides (as F), mg/L, Max | 0.42 | ND (<0.05) | 2 | No problem |
| Arsenic (as As), mg/L, Max | 0.008 | 0.016 | 0.20 | No problem |
| Cadmium (as, Cd), mg/L, Max | ND (<0.003) | ND (<0.003) | 2 | No problem |
| Hexavalent chromium (as Cr), mg/L, Max | ND (<0.05) | ND (<0.05) | 0.10 | No problem |
| Copper (as Cu), mg/L, Max | 0.063 | 0.029 | 3 | No problem |
| Lead (as Pb), mg/L, Max | 0.018 | 0.038 | 0.1 | No problem |
| Mercury (as Hg), mg/L, Max | 0.004 | 0.004 | 0.01 | No problem |
| Nickel (as Ni), mg/L, Max | ND (<0.05) | ND (<0.05) | 3 | No problem |
| Selenium (as Se), mg/L, Max | ND (<0.05) | ND (<0.05) | 0.05 | No problem |
| Zinc (as Zn), mg/L, Max | 0.52 | 0.20 | 5 | No Problem |
| Ammonical nitrogen, mg/L, Max | 133.1 | 85.95 | 50 | Not efficient |
| Chemical Oxygen Demand, mg/L, Max | 2625 | 940 | 250 | Not efficient |
| Total dissolved solids(TDS), mg/L | 3540 | 2520 | 100 | Not efficient |
Effluent analysis of ten selected woolen units was found to be of very high degree of pollutants containing and violating the standard parameters TDS was found to be of range 38-348 mg/l. Three samples S3, S4, S9 were found to be of high value TDS.258, 310, 348 respectively. BOD for all the ten samples was found to be above the standard limits S9 was found to be of very high BOD value -1750mg/l.Simillarly the oil and grease containts were found above the standards limits ranges from 19.80-200mg/l. S1 and S9 were at highest value-102.8 and 190.6 ml respectively. COD value was very high than the standard limits ranges 110-2000mg/l. S4, S6, S9 were found with avery large COD 1500,1000,2000 mg/l respectively. Sulphides were found at high level than the standards ranges from06-18mg/l. sample -4 was found to be of the very high pH-11.17.
Sample analysed for Jorbir treatment plant found to be with a high degree of pollutants and above from the standard parameters with high value of TDS , BOD, COD , oil contants & pH . The inflow waste water sample was found to be of cointaing a large amount of heavy metals Pb-
Conclusion
62.6mg/l, As-16.02mg/l, Cd-34.08mg/l, Cr-15.56mg/l, Hg-12.33mg/l, Zn-15.23mg/l,. Cu-9.3mg/l.Ni-8.87mg/l.
As there is no removal treatment methodology is adopted in this treatment plant, the outflow treated water samples were found almost with the similar high potent value of the heavy metals contain. BOD , COD , TDS OIL contains for outflow treated water was also found to be of above the standard permissible limits.
Results shows that the waste water contains a high degree of the pollutants and the heavy metal. Regarding the treatment efficiency the
outflow treated water shows almost same results for heavy metals and other parameters, which are above the standard permissible limits. Regarding the heavy metals lead level was found to be of highest 61.09mg/l. Simillarly other metalas As, Cd, Hg, Cu, Ni, Zn, Cr were found at 15.09, 34.66, 11.55, 8.23,8.37,14.75,14.9 mg/l respectively.
The pollution load along with its stretch is very high. Among various sources of pollution, wool dying and processing industries are one of the major sources.
Industrial effluents found to be fully loaded with hazardous pollutants including several heavy metals. None of the industries are following the rules & regulations regarding to preventing the pollution and heavy metal exposure to human population even to its own employees. There is also lack of awareness regarding the human health and the adverse effects in most of the industries. Woolen industries are found to be contributing a more regarding to the pollutant effluents as they expel a much of the effluent load.
There is not any perfect effluent drainage system for the industrial effluents in any industrial area surveyed. However much of the effluent lo is drain in to a waste water treatment plant situated in outer part of the city the Jorbir area. Effluents in this treatment plant were analyzed through highly précised techniques and found to be loaded with hazardous pollutants including hazardous heavy metals. Efficiency of the treatment plant found to be very poor as there is lack of management in the administrative system as well as there is not any system regarding to removal of hazardous heavy metals from the effluents.
Treated and untreated mixed effluent water is being used for the cultivation of vegetables on very large scale in the adjoining area of the treatment plant. Regarding to this vegetables are found to be congaing a hazardous amount of the heavy metals, which are largely consumed by the subpopulation and area contributing very serious present and delayed adverse health effects in the subpopulation .
The Jorbir treatment plant which has been constructed at the huge cost (544 lac. INR) to prevent the discharging of solid and untreated waste to free land is primary failed due to mismanagement and negligence towards duty, existing as a demo figure only.
The treatment plant is not efficient to treat the incoming waste as per its design parameters as shown from the efficiency testing results. Plant has been found inefficient to treat parameters like TSS, BOD, COD, Oil and Grease, Ammonical Nitrogen etc as per the prescribed government standard for these most polluting parameters. However, plant is efficient to treat only up to 40-50percent the standard level.
All the ten (100%) Wool Dying and Processing Industries are failed to fully comply with the Government standard specified for this group of industry. All industries are discharging their effluent containing lower value Cr and Phenolic compound than standard. However, majority of the industries (80%) are discharging their effluent containing very high value of BOD (Max 625 mg/L) Oil & Grease (Max 190 mg/L), COD (Max 1500 mg/L) and Sulphide (Max 26 mg/L) than that of standard. Forty percent ( 4 out of 10;S5,S6,S7,S9) of the industries releasing very acidic effluent where as only ten per cent (I out of 10; S4) industries discharging very strong alkaline effluent. Rest fifty percent industries comply with the pH standards value. This concludes the heavy pollution to environment and contributing toward least efficiency of common waste water treatment plant.
Recommendations
Regular monitoring of wool industrial Pollution is necessary to take proper action against polluters and implement protective measures.
Pollution controlling mechanism is almost paralysed, Government should take immediate and serious steps to improve the reliability and responsibility of SPCB and CPCB to ensure of pollution controlling measures and regulations with loyalty as it‘s its moral duty to provide healthy environment and hygiene to citizens.
All the industries establishment should have their own treatment plants and should not allowed discharging effluent stronger than the prescribed standards.
The efficiency of the treatment plant need to be improved and the diversion provision of untreated waste water need to be completely closed from directly discharging to free land..
A mechanism of paying of the operation cost of the treatment plants by individual industries owners and households need to be rearranged and regulated to sustain the operation of treatment plant with improved efficiency.
This kind of monitoring program need to be expanded in other part of the Bikaner city in collaboration of concerned government agencies and NGO’s with competent subject experts as well as promotion of research in this field and establishment of specialized hi-tech laboratory at district headquarter level.
There should be an active public participation in compliance of environmental pollution laws regarding making penalties and regular monitoring involving competent and empowered public representatives.
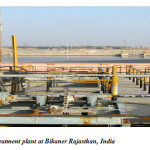 |
PLATE-01-Huge view of jorbir wastewater treatment plant at Bikaner Rajasthan, India Click here to View Plate |
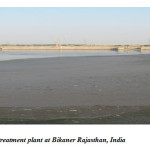 |
PLATE-02-Out flow pond of jorbir wastewater treatment plant at Bikaner Rajasthan, India Click here to View Plate |
Refrences
- State of the Environment, India, HMGN/MOPE, 2001, pp. 6, 15-16, 124
- Development Issue Vol1, Issue 2, August-October 2002 p 1-4
- Ministry of Finance, 2003
- CBS 19982 and * CBS 2004: Statistical Pocket books, p 187-190
- 3. Environmental Pollution in Nepal, A review of Studies, Kathmandu, IUCN/NPC 1991.
- Dara, S.S., 2001, A Text Book of Environmental Chemistry and Pollution Control, p 39-42, 209-210,
- V.P.Kudesia, Water Pollution, p422-24
- Industrial Effluent & their use in Agriculture along Narayani River Nawalparasi, Nepal. (Environmental & Agriculture, at the cross road of the New millennium, 2000, pp. 456-466.)
- Waste Water Treatment, 2nd ed. M.N. RAO, A.K. Datta, 1978, pg. 19-20)
- Environment. chemistry, 3rd ed, 1994, A.K. De, pg., 278
- A Handbook of Decomposition Methods in Analytical Chemistry. International Texbook Company, Glasgow. Bohn, H.L., McNeal, B.L., O’Connor, G.A.K., 1976. Soil Chemistry. John Wiley and Sons, New York.
- David, H.F.L., Bela, G.L., Paul, A.B., 1996. Environmental Engineers Handbook, 2nd Ed. Lewis Publishers, New York.
- Ghafoor, A., Rauf, A., Arif, M., Muzaffar, W., 1994. Chemical composition of effluents from different industries of the Faisalabad city. Pak. J. Agric. Res. Sci., 31:367-369.
- Gulfraz, M., Afzal, H., Malik, A.A., Asrar, M., Hayat, M.A.,1997. A study of water pollution caused by the effluent of various studies located in the vicinity of Sohan River. Pak. J. Sci., 49(1-2):13-17
- Gulfraz, M., Mussaddeq, Y., Khannum, R., Ahmad, T., 2002. Quality assessment of effluents from various industries in the vicinity of Rawalpindi and Islamabad. On Line J. Biol.
- Schnitzer, M., 1978. Humic Substances: Chemistry and Reactions. In: Schnitzer, M., Khan, S.U. (Eds.), Soil OrganicMatter, Chapter 1. Elsevier, NY.

This work is licensed under a Creative Commons Attribution 4.0 International License.
![]()
A New Edition of Web of Science
Journal Impact Factor
2022: 0.5
Five Year: 0.8
Journal is Indexed in

Cabells Whitelist
![]()


