The study of subsidence on chemical properties of oil resource by using Interferometry synthetic aperture radar technique
Abdolreza Memari
Department of Petroleum Engineering, Mahshahr Branch, Islamic Azad University, Mahshahr, Iran
DOI : http://dx.doi.org/10.13005/ojc/290422
Article Received on :
Article Accepted on :
Article Published : 08 Jan 2014
Land subsidence due to slow compaction sediments is one of the most dangerous cases in nature. Human activities such as removal of hydrocarbons are one of the environmental issues. While traditional mapping can determine the rate of subsidence factors in depression but according to the criteria and the cost of this type of mapping it always need to use modern techniques. Nowadays, one of the most advanced methods to obtain the reservoir subsidence in centimeter accurately is INSAR(Interferometry synthetic aperture radar) .The main purpose of this research is estimating and studying about one of oil fields, that the rate of subsidence is significant in it and in addition the main reasons of it has been studied. The results are consistent so much with the observed changes of field production data. The results show that the INSAR method can be used so extensively in industrial and research projects. We think the results of study the subsidence effect will be useful to detection of chemical properties variations the oil resources such as concentration, viscosity and other chemical properties.
KEYWORDS:surface subsidence; oil well; removal of hydrocarbons; production rates; INSAR
Download this article as:| Copy the following to cite this article: Memari A. The study of subsidence on chemical properties of oil resource by using Interferometry synthetic aperture radar technique. Orient J Chem 2013;29(4) |
| Copy the following to cite this URL: Memari A. The study of subsidence on chemical properties of oil resource by using Interferometry synthetic aperture radar technique. Orient J Chem 2013;29(4). Orient J Chem 2013;29(4). Available from: http://www.orientjchem.org/?p=1471 |
Introduction
According to the United States institute of geology, phenomenon of land subsidence is collapse or subsidence of land to down of the earth’s surface which can be scarcely horizontal displacement vector .The movement regarding to the severity, extent and rate of conflict zones had not been limited and subsidence can be caused by natural geological cases such as solubility, density, melting ice deposits, slow moving and lava shell of the solid earth which is coming out. Meanwhile human activities such as mining and extracting the underground waters or oil can be the other reasons of this issue. [2,3] According to UNESCO this phenomenon is collapse subsidence of land surface that due to various causes occurs on large scales. These phenomena does not include landslides which have a significant horizontal motion vector and also does not include manual soiled settlement [5] .In a study by Carnec et al. (1996) that had done in Gardanne mine in south of France, Significant subsidence occurred in the 1990s which had been starting in the same time with the beginning of the mechanical extraction of coal. Underground caves collapsed, at a distance of 1000 m above ground level with its gradual subsidence without causing obvious failures. More vertical displacement with the basin structure is strengthened and causes local earthquakes [6]. On the base of the information of (IHP) the oldest Subsidence that has been known has happened in the United States in Alabama in 1900s.Basical studies of the working group are on 42 Detailed of depression in 15 countries. Subsidence of the working group was formed in Paris in April 1975 to work on the relationship of this phenomenon with the formation of underground resources. Since then, most studies in this case has been done in developed countries, especially in the United States that its result had been tighted control of hydrocarbon production and changes in production patterns and stop subsidence in many cases[4]. In these studies, advanced methods and new techniques such as geo-locate (position) systems (GPS), radar (INSAR & SAR) to locate subsidence widely used.
ASAR images
Synthetic Aperture Radar Interferometer is a remote sensing technology that was invented to study the movements of the earth’s surface in 1992 lenders California earthquake. INSAR is derived from Synthetic Aperture Radar
Interferometer which is discussed INSAR in this paper. In This technology which combined with obtained data from imaging radar systems that installed on aircraft or satellite platforms, moves and height changes in surface are mapping by it. Basic measurements of ground motions are using the repeated images of radar. The picture that has taken from an area in a specific time (reference time) is integrated with another one when they are picked up by the radar sensor [7]. The deformations of human performance in the Earth’s crust are often contains small parts that do not contain more than a few pixels at a resolution of 20 meters in a front interference. They are vary to create the range of a few centimeters during less than 10 years .The example of this activities is 0.3 change phase cycle in dewatering agricultural land [8] .
Methods
Maroon oil field is one of the largest oil fields in the South West of Iran that has located in north east of Ahvaz. in fact it adjacent in the north east fields of koopal , Aghajari, Ramin , Shadegan and Ramshir .Its Length had been 67 km , its average width had been 7 km and in Terms of geologic basins of it has located in the eastern part of fallen branch in north of Dezfoul .The first step to determine the amount of surface deformation (subsidence or uplift) on Maroon oil field by using differential interferometer techniques is the Asar images of invest satellite that have been prepared. In this case, due to lack of access to the images of the region inside the country, the draft plan based on order request of archive photos in Europe Space Agency (ESA) prepared and it has sent by category users. In ASAR interferometer techniques its process required to the raw images acquired at GAMMA specialized software to identify and be readable. So many steps in the preprocess are considered for preparing individually oriented complex image (SLC) [1].With processing ASAR interferometer techniques 12 Asar images framed in zero level which has been listed in Table 1[9].
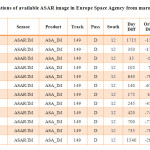 |
Table 1.Specifications of available ASAR image in Europe Space Agency from maroon oil field |
After removal of topographic effects, 31 interference patterns have been retrieved that some of them were excluded due to having high spatial baseline (more than 260 meters as the baseline recession) or a long period of time are not suitable for interpretation; In other words, in the mentioned interferences due to the lack of high coherence, the retrieval phase had not become successful. Figure 1 , shows that each one of the images obtained from the baseline position and different spatial orientation .In this figure it has shown that each one of the obtained images on the base of base line position and spatial are different.
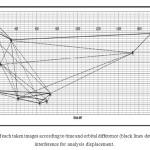 |
Figure 1. Position of each taken images according to time and orbital difference (black lines determiner good front interference for analysis displacement. |
In this figure black lines discriminate proper interference and dotted lines shows front interference that is unable to enter the recovery phase because of various reasons. Among of 31 interference patterns which have produced only 16 cases found their way to the recovery phase and orbital phase which are related to the error was removed. These conflicting views and properties are given separately in Table 2. Existence of atmospheric effects were also considered from the vision and climatic data to set the conflicting views in order to analyze surface deformation caused by manufacturing or construction shall be select.
Selecting interference pick views has done by quantitative measure of the average baseline level of coherence, spatial and temporal .However, it was also very useful to consider the visual of interaction views in a way that leads to severe atmospheric turbulence and eliminated interfere with shots. In other words, comparing front interference that involved the same period overlapping shots appears the Fringe atmospheric dispersion models posing in an interaction.
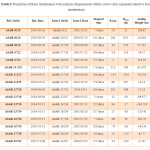 |
Table 2: Properties of front interference with analysis displacement ability.(rows color represent selective front interference) |
Results and discussion
The pattern of well No. 4 (east of the southern flank of the field)
By studying in this well it has characterized that with 1.3 percent increasing in production in the first half of the 2005 the increase of surface deformation has been none effective and gentle slope deformation rate has increased. if we compare it with July to September 2004 it seems that this increasing has done very quickly and with greater speed and acceleration.
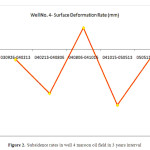 |
Figure 2. Subsidence rates in well 4 maroon oil field in 3 years interval |
In general, the comparison of gauge interactions has obtained, it shows that in two-year period surface deformation signals the range of initial conditions changes and the surface elevation (subsidence) have decreased.
However, it is possible to be seen in the uplift signal return in final front interference. This signal that coincidence exactly with subsidence of front interference until April 2005 than status range in 2003 slightly moved east and have wide range .This phenomenon due to change in production pattern in 2005 than to 2 years ago or hydrocarbon fluid migration to north east of field. Notice those well 4 on 2753 meters is on subsurface Asmari reservoir .Depth perception can also be an indirect factor that in the deformation behavior of wells of the fields that we can examine (test) it.
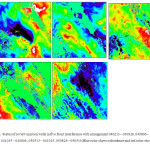 |
Figure 3. Status of review maroon wells in five front interference with arrangement 040213 – 030926, 040806 – 040213 , 041015 – 040806 , 050513 – 041015 , 050826 – 050513(Blue color shows subsidence and red color shows uplift) |
The pattern of well No. 40 (North flank of the eastern part of field)
The surface deformation in this field is quite distinct from the previous section. Although no production of oil or gas from these wells has not studied in a period of time, but there is considerable surface deformation. Figure 2 corresponds to the from date September of 2003 to July 2004, the surface height 6.7 mm has decreased, while levels could retain the reducing of their height within 2 months and the picture retains September 2004 date conversion remain constant. In seven months later, we have faced a significant decreasing in the level which had been approximately 5.13 mm that despite the decreasing in gross and surface elevation production decreased again in this part meanwhile it became as a result that controlling surface droop compensation to be approximately 10.5 mm.
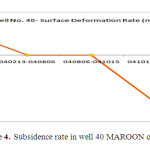 |
Figure 4. Subsidence rate in well 40 MAROON oil field |
Whatever that obtained from the chart of deformation and producing oil and gas wells in Maroon oil field , They show that in the period of April to August 2005 , phenomenon has caused by increasing in the production field in all sectors of field has changed, except central field part of the uplift . These cases should be reviewed to determine the main reason .Since the time interval is too short therefore there are two reasons for this phenomenon
Interpretation from geometric characteristics and anticline structural approach
Maroon anticline disharmonious shows that wrinkling is so shallow and superficial of Mishan is above formations and below Aghajari separated by a horizontal separation of 2 wrinkling of Gachsaran. . So we are actually dealing with two-fold of both thrust in the south-western edge that has observed. Thus, both surface and subsurface anticlines are fault-related folds. Seismic section shows fault in southwestern and reverse fault in northeast flank of the anticline has shown. Based on available evidence, the main fault to the top of the Asmari Formation is cut and moved. Operation of fault in seismic sections to Eilam and Sarvak clearly visible. Furthermore, thrust anticlines subsurface seismic sections prove that no adaptation and thrusts of Maroon and the thrust surface of maroon are exactly separated from each other. Maroon anticline fold axis of quasi-horizontal axial surface area is steep and on the base of the angle between the eastern edge and central wrinkling is open but at the end of northwest wrinkling is going to be smoother. According to geo-magnetic andseismic data, a simple model for regional basement faults is presented. In this model, Dezful fallen three-block area in the basement fault displacement between them were identified. The three-dimensional model, Dezful Embayment is presented to the basement, Basement uplift in the eastern part of the basin and the central part of the anticline axis is the main reason for the deviation.on other hand the southeast end of the basement faults, anticlines of Strain and density is higher. Three axial bending is over bend anticline axis that the field could divide into three parts: the eastern, central and western. These strength bendings has created because of the region system and other factors have contributed to it. So that asymmetric and non-cylindrical shape of the eastern flank of the south-western slope of the increase can be induced.
Modeling of tectonic subsidence
Due to not measuring the subsidence before oil extraction in the field, the only way to estimate the tectonic subsidence is modeling it. In this regard, the evaluation of vertical deformation occurs due to the movement of continental plates and the mean value of the velocity as an approximation of the effect of faults is used to cut and pull the center and tectonic displacement or maximum time by assuming the absence of strong earthquakes in the region is evaluated. The error resulting from the assumption of a direct fault is uncertain and does not affect to the results so much. Coulomb 2.0 program should be used to calculate the Subsidence [11]. The effects of compaction and subsidence rates isostazi that can affect the model, is not considered. Consistent with the results documented in density and isostazi, tectonic subsidence rates of the two processes together they will increase more than 40 percent of the estimated rate.
Conclusion
As the results are presented in the case of behavior of Maroon field deformation from the visual was assessed in two parts. Although the extracted patterns is the same in all wells in the field and subsurface fluid pressure that has occurred, But the behavior of eastern part of production field is different than other part ,this origin can be a part of tectonic factors such as surface and subsurface thrust anticlines dual southwest edge, high activities of basement faults and the degree of thermal gradient, thickness, faulting and uplift Gachsaran formation and break tank and oil migration in this section will be considered. Thus it can be mention that the effect of tectonic parameter distinct the behavior of wells in this region to rate of production from beginning production than another parts.
The well in northern crest has behavior that can be considered the effect of tectonic and production rate. Although eastern section is formed from dolomite and central and western part formed from flexible limestone but thickness of Gachsaran formation in whole part of northern crest is negligible that can be considered in relative similarly observed deformation in images of this part. As it is clear from the results, both factors, tectonic and non tectonic parameters have affect on subsidence of maroon field. While evaluating of the change in how human activity affects the levels of stress and seismic field shows tectonic subsidence modeling of the tectonic stress changes without effects on different parts of the field is possible.
Suggestions:
- INSAR technique should apply to detect changes in the oil fields with less depth, their flat topography and low humidity
- Study on relation between subsidence and reservoir fracture and pressure drop.
- Study on Gachsaran creep and its effective parameters in compaction process.
- Determine acceptable subsidence with economic approach with consideration reservoir and production parameters.
- Develop physical model of Asmary reservoir pattern deformation in maroon oil field.
- Compilation results of modeling of surface deformation and INSAR data.
- Use images with less sensitive to plant covering and atmospheric effects such as L-band ALOS PALSAR sensor
- Repeat accomplished project in longer time intervals.
Acknowledgements
We are gratefully thanking and appreciating financial supports from the research council of islamic azad university, Mahshahr branch. This article is extracted from research project with the study of subsidence on chemical properties of oil resource by using Interferometry synthetic aperture radar technique.
Reference
- Moghadam N.,MatkanA., Detection of surface deformation based on Interferometry synthetic aperture radar in Aghajari oil field. Iranian geology science, 368, 1795-1797(2009).
- Alley R. B,,Whillans J. M., Changes in the west Antarctic ice sheet, Science. 254, 959-963 (1991).
- Barr T.D, Dahlen F. A, Brittle frictional mountain building Journal of Geophysical Research, 94, 3923-3947(1989).
- Bénédicte F., Christophe D., and Jose’A., Observation and modelling of the Saint-Etienne-de-Tinée landslide using SAR interferometry (1996).
- Bilham R., Earthquakes and sea level space and terrestrial geodesy on a changing planet, Reviews of Geophysics, 29, 1-29(1991).
- Blom R., Crippen R.E, and Elachi C, Detection of subsurface features in Seasat radar images of Means Valley Mojave Desert California, Geology 12, 346-349(1984).
- Bull W.B., Geomorphic response to climatic change, Oxford University Press, 326-332(1991).
- Carnec C., Massonnet D., and KingC., Two examples of the application of SAR interferometry to sites of small extent, Geophysical Research Letters, 23, 3579–3582(1996).
- Wagner W., Blöschl G., Pampaloni P., Calvet J.C., Bizzarri B., Wigneron J. P., Kerr Y., Operational readiness of microwave remote sensing of soil moisture for hydrologic applications, Nordic Hydrology. 38(1), 1-20(2007).
- Cosh M. H., Jackson T. J., Starks P., Heathman G., Temporal stability of surface soil moisture in the Little Washita River watershed and its applications in satellite soil moisture product validation, Journal of Hydrology. 323, 168-177(2006).
- Loew A., Mauser W., on the dissagregation of passive microwave data using priori knowledge on temporal persistent soil moisture fields, IEEE Transactions on Geoscience and Remote Sensing, 387-391(2008).

This work is licensed under a Creative Commons Attribution 4.0 International License.
About The Author
![]()
A New Edition of Web of Science
Journal Impact Factor
2022: 0.5
Five Year: 0.8
Journal is Indexed in

Cabells Whitelist
![]()


