Physico-chemical Investigation of Semiconductor Industrial Wastewater
Y.C.Wong*,V. Moganaragi and N.A. Atiqah
Faculty of Agro Based Industry, Universiti Malaysia Kelantan,Jeli Campus, Locked Bag 100, 17600 Jeli, Kelantan, Malaysia
DOI : http://dx.doi.org/10.13005/ojc/290418
Article Received on :
Article Accepted on :
Article Published : 28 Dec 2013
The treated and untreated effluents samples from semiconductor industry were collected and thier physical characteristics such as temperature, pH, turbidity, total suspended solid (TSS), conductivity and chemical characteristics such as salinity, dissolved oxygen (DO), biological oxygen demand (BOD), chemical oxygen demand (COD), chlorine dioxide, and heavy metal were analyzed. The results obtained showed that the semiconductor industry fulfilled the standard of law that was established in order to protect the environment.
KEYWORDS:semiconductor industry; wastewater treatment; heavy metal; treated effluent.
Download this article as:| Copy the following to cite this article: Wong Y. C, Moganaragi V, Atiqah N. A. Physico-chemical Investigation of Semiconductor Industrial Wastewater. Orient J Chem 2013;29(4) |
| Copy the following to cite this URL: Wong Y. C, Moganaragi V, Atiqah N. A. Physico-chemical Investigation of Semiconductor Industrial Wastewater. Orient J Chem 2013;29(4). Available from: http://www.orientjchem.org/?p=1314 |
Introduction
Precipitation, surface water runoff, surface water and groundwater storage and evaporation are involved in the hydrologic cycle, which caused the occurrence of changes to the quality of the water body. For instance, precipitation in the form of rain or snow can bring airborne pollutants to the Earth’s surface; surface water runoff can cause erosion andtransport sediments; groundwater recharge can leach chemicals into aquifers; and evaporation can elevate concentrations of pollutants in bodies of water by dropping the total volume of stored water. Each natural component of the hydrologic cycle can have a negative effect on surface and groundwater quality. Ashuman beings, we also have great effects on water quality. We add waste to the environment through the utilization of resources such as food, clothing, housing, and fuel for transportation. The fast growing world population is contributing to the fall of our existing water quality and is creating significant challenges for water managers, industry and fish and wildlife agencies [1].
The water quality measurement consists of several parameters that can be measured using proper methods. Some simple measurements such as temperature, pH, dissolved oxygen, conductivity, salinity and total dissolved solid can be measured on the site [2].
Wastewater quality can be defined by physical, chemical, and biological characteristics. Physical parameters include colour, odour, temperature, solids (residues), turbidity, oil, and grease. Chemical parameters associated with the organic content of waste water include the biochemical oxygen demand (BOD), chemical oxygen demand (COD), total organic carbon (TOC), and total oxygen demand (TOD). Inorganic chemical parameters include salinity, hardness, pH, acidity, alkalinity, iron, manganese, chlorides, sulfates, sulfides, heavy metals (lead, chromium, copper, and zinc), nitrogen (organic, ammonia, nitrite, and nitrate), and phosphorus whereas the bacteriological parameters include coliforms, fecal coliforms, specific pathogens, and viruses [3-4].
The most general physical characteristics of water are colour, odour, temperature, taste, and turbidity while biological characteristics of water are living organisms including bacteria (e.g. Escherichia coli), viruses, protozoans (e.g. Cryptosporidiosis), phytoplankton (i.e. microscopic algae), zooplankton (i.e. tiny animals), insects, plants, and fish [5].
For the past few years, electronic industries are well developed sector in many countries around the world. In coming years, this electronic industry is predicted to expend its growth to a wider prospect. Semiconductors are one of the essential products which are produced by the electronic industries. The semiconductors are used in various types of equipment such as computer devices, telecommunication devices, consumer electronic products, electronic control devices, scientific and also in medical test equipments. The processes involved in the production of semiconductors consisted of complex and highly mere processes including silicon growth, oxidation, doping, photolithography, etching, stripping, dicing, metallization, planarization, cleaning, and etc. [6,7,8]. The manufacturing processes of semiconductor integrated circuits involved over two hundred types of organic and inorganic substances (proprietary and generic). Some of the steps in the sequences are water back grinding, sawing, die attach, wire bonding, encapsulation, electroplating, trim and form and marking[8-9].
According to HACH Company (2010) showed that the colour of the semiconductor wastewater was milky and this was because of the occurrence of fine suspended oxide particles. The total solid (TS) contents in semiconductor waste water was high, which was 4500 mg/L but the suspended solids (SS) concentrations of both samples were small, being less than 0.2 mg/L. This was as a result of the fact that the size of the fine suspended oxide particles was below the pore size 0.45 μm of the standard filter paper used for the SS measurements while the TS concentration was calculated by drying the sample in a crucible which retained all the fine oxide particles [10].
In addition,the semiconductor wastewater used in their study had a pH 9.5 and very low suspended solids concentration at 10 mg/L, and high chemical oxygen demand (COD) concentration of over 70000 mg/L. They also found that the biodegradability of the wastewater as represented by the ratio of BOD/COD was low at 0.124, reflecting the existence of recalcitrant organic compounds. They further noted that the COD concentration of the semiconductor wastewater was due to mixing of the semiconductor wastewater with other processes wastewater streams that contained organic compounds, but little total solids. Hence, COD removal from the semiconductor wastewater is as important as the removal of fine suspended oxide particles if the semiconductor wastewater is to be upgraded to a level for general reusepurpose [11].
The objectives of this study are to identifythe characteristics of industrial wastewater before and after treatment, the quality that must be maintained in the environment to which the wastewater is to be discharged or reuse and provideunderstanding in the methods involved to analyze various physical and chemical parameters of the wastewater.
Methodology
Sampling method
Sample collection is important in deriving relevant data that may be utilized to make important decisions [12]. Samples were collected from a semi-conductor company for analysis of various physical and chemical parameters such as temperature, pH, turbidity, total suspended solid (TSS), conductivity, biochemical oxygen demand (BOD), chemical oxygen demand (COD), dissolved oxygen, salinity, chlorine dioxide and heavy metal contents. Samples were taken from two points namely as untreated effluents and also treated effluents and were collected in clean dry plastic bottles in such a way that no bubbles were formed in the bottles. The bottles were foiled with aluminium foil and filled with preservatives such as 3.0ml of sulphuric acid (50%) for COD while 1.5ml of nitric acid (50%) for heavy metal to keep the samples below pH 2 except BOD which did not require any preservatives. Aluminium foil was used to avoid any undesirable chemical reaction by sunlight. After that, the samples were incubated at 4°C prior to any chemical analysis in laboratory. Take note that all of the sample bottles were labelled properly to avoid any confusion.
Analytical procedures
Determination of temperature, pH, conductivity, dissolved oxygen and salinity.
Temperature, pH, conductivity, dissolved oxygen and salinity were determined by using a Multi parameter which was measured at the site of the collection. The probe module was rugged, with the sensors enclosed in a heavy duty probe sensor guard with attached sinking weight. A 4, 10 or 20 meter cable was directly connected to the probe module body making it waterproof [13].
Determination of turbidity
Turbidity was determined by using Turbidimeter which was measured at the site of the collection. The HACH 2100P Portable Turbidimetermeasures turbidity from 0.01 to 1000 NTU in automatic range mode with automatic decimal point placement. The manual range mode measures turbidity in three ranges: 0.01 to 9.99, 10 to 99.9 and 100 to 1000 NTU. Designed primarily for field use, the microprocessor-based Model 2100P have the range, accuracy, and resolution of many laboratory instruments [14].
Determination of Total Suspended Solid (TSS)
TSS was measured by using filtration method. To determine total suspended solids, a piece of filter paper was weighed out as accurately as possible. Then, the water sample was allowed to pass through the conical flask where the filter water was placed in the conical flask. The filter paper was allowed to dry completely and was put in incubator for 24 hours. The change in the weight was the weight of the total suspended solids.
Determination of Biochemical Oxygen Demand (BOD)
BOD was measured using HACH HQ 40D (HACH, 2010). The instrument was used with digital IntelliCAL™ probes to measure various parameters in water. The meter recognizes the type of probe that was connected to the meter (HACH, 2009). BOD was measured by first preparing sample dilution water using a BOD Nutrient Buffer Pillow. Then, the mixture was stirred using HACH HQ 40D to remove all the bubbles. After all the bubbles were removed, the reading of the dissolved oxygen content was taken using HACH HQ 40D. Then the sample bottle was wrapped with aluminium foil and incubated for five days.
After five days, the readings for the dissolved oxygen contents after incubation were taken. The readings indicate the amount of dissolved oxygen. BOD measured the rate of oxygen uptake by micro-organisms in a sample of water at a temperature of 20°C and over an elapsed period of five days in the dark. To calculate the BOD, equation 2.1below was used:-
BOD = DI – D2P (2.1)
Where, D1 = Dissolved oxygen content before incubation.
D2 = Dissolved oxygen content after incubation after 5 days.
P = the volume of the sample 100 total volume of the bottle 300ml
Determination of Chemical Oxygen Demand (COD)
The DR 5000 Spectrophotometer is a scanning UV/VIS spectrophotometer with a wavelength range of 190 to 1100 nm. The DR 5000 is used for testing in visible and ultraviolet wavelengths. A gas filled tungsten lamp produces light in the visible spectrum (320 to 1100 nm), and a deuterium lamp produces light in the ultraviolet spectrum (190 to 360 nm). The DR 5000 Spectrophotometer provides digital readouts in direct concentration units, absorbance, or percent transmittance. When a user generated or programmed method is selected, the on-screen menus and prompts direct the user through the test. Running an analysis with the DR 5000 was relatively simple and involved reading of the sample where the instrument measures the amount of light passing through a reacted sample and converts the transmitted light into a concentration [15]. COD was measured by homogenizing 100 ml of sample using a blender for 30 seconds. The homogenized sample was stirred with a magnetic stirrer plate. Then, 2.0 ml of homogenized sample was poured into COD buffer, vial, and closed with a cap. The solution was inverted for several times before placed in preheated reactor. The vial was heated for two hours. After two hours, the reactor was turned off and the vial was left to cool to 120ºC or less for 20 minutes. Then, it was inverted again several times and placed into a rack to cool to room temperature before it was placed inthe cell holder of the spectrophotometer for measurement of COD value. The steps were then repeated with the treated effluents. Chlorine dioxide was also measured using HACH DR 5000 Spectrophotometer. A small amount of sample (10mL) was taken and poured into the sample cell before placing it inside the spectrophotometer. The results were recorded directly from the meter and were repeated for treated effluents.
Determination of heavy metals
For the analysis of heavy metals which were Copper (Cu), Zinc (Zn), Iron (Fe), Manganese (Mn), Aluminium (Al), Cadmium (Cd), Lead (Pb), and Chromium (Cr), the samples were analyzed on Atomic Absorption Spectrophotometer (Perkin Elmer) as shown in Figure 3.6 for concentration using specific cathode lamp. In AAS, the water sample was aspirated, aerosolized, and mixed with combustible gases (e.g. acetylene air, nitrous oxide), then vaporized and atomized in a flame at temperature of 2100 to 2800°C. The atoms in the sample were transformed into free, unexcited ground state atoms, which absorbed light at specific wavelengths. A light beam from a lamp whose cathode was made of the element of interest was passed through the flame. The amount of light absorbed was proportional to the concentration of the element in the sample [16].
Results and Discussion
Table 1 showedthe treated effluents and the untreated effluents.As shown, the treated effluents had good results compared to untreated effluent on pollutants. From Table 1, the untreated effluents and treated effluents had almost similar temperature which was 27.57°C and 27.83 °C respectively. Compared to the Environmental Quality (Industrial Effluents) Regulations 2009, the temperatures were considered low as the standard given was 40°C. Excessive temperature changes can accelerate chemical processes and can be detrimental to aquatic plants and wildlife. Increased heat in water can reduce its ability to hold dissolved oxygen, while sudden temperature ‘shocks’ (often caused by heated industrial water release into a lake or stream) can be harmful to many aquatic species [1].
From Table 1 the pH of the untreated effluents was 6.30 which was slightly acidic compared to the treated effluents which had the neutral pH of 7.44. Both pH values were within the permissible limits for industrial effluents set by Environmental Quality (Industrial Effluents) Regulations 2009. High pH causes a bitter taste and low pH water will corrode or dissolve metals. A pH range of 6.0-9.0 is needed for healthy ecosystems. Sudden pH change often indicates chemical pollution [16].
Turbidity is a measure of the degree to which the water loses its transparency due to the presence of suspended particulates [17]. Turbidity in water is due to the occurrence of suspended matter which results in the scattering and absorption of light rays. Turbidity can be caused by phytoplankton or by sediments suspended in water. Water that is brown in colour is high in sediments while green, turbid water contains phytoplankton and other growths of aquatic life. It is well observed where the untreated effluents have the more suspended particulates that is 727.7 NTU whereas the treated effluents only with 1.65 NTU. High turbidity levels can indicate several problems for the water body. Turbidity blocks out sunlight needed by submerged aquatic vegetation. It also indicates low levels of dissolved oxygen caused by suspended solid [1].
The conductivity measured in the untreated effluents was 0.241mS/cm, which was lower than the treated effluents with value of 0.44mS/cm. High conductivity indicates the presence of high dissolved salt such as chloride, sulfate, sodium, calcium and others sources. Increases in this dissolved salt may affect the aquatic organisms [16].
The TSS values (Table 1) of the untreated effluents and treated effluents were 22.37g and 0.00g respectively. Both samples had low TSS values, but the treated effluents can be considered having no TTS value. Untreated effluents with that amount of TSS may cause handling problem, if this effluent is discharged to river or stream, it will make it unsuitable for aquatic life where the high amount of suspended solid will block the sunlight needed for the aquatic organisms to live and cause depletion of oxygen level.
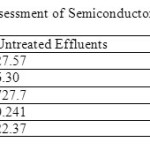 |
Table 1: Physical Assessment of Semiconductor Waste water Effluents |
The salinity measured for untreated effluents was 0.19 whereas for treated effluents was 0.07. High salinity (the presence of excess salts in water) can be harmful to certain plants, aquatic species, and human. High levels of salts in drinking water can lead to high blood pressure and other health concerns for humans.
While water molecules hold oxygen atom, this oxygen is not what is required by aquatic organisms living in our natural waters. A small quantity of oxygen, up to about ten molecules of oxygen per million of water, is actually dissolved in water. This dissolved oxygen is breathed by fish and zooplankton and is needed by them to live. Other gases can also be dissolved in water. In addition to oxygen, carbon dioxide, hydrogen sulfide and nitrogen are examples of gases that dissolve in water. Gases dissolved in water are significant. For example, carbon dioxide is important because of the role it plays in pH [18-19].
From Table 2, the untreated effluent had the value of 3.98 mg/L and the treated effluent had the value of 5.52mg/L. High levels of dissolved oxygen within the standard allow a variety of aquatic organisms to thrive [1] whereas many living organisms cannot survive in waters with DO levels of less than 1mg/L for more than a few hours.
BOD was determined by incubating a sealed sample of water for five days and measuring the loss of oxygen from the beginning to the end of the test. Samples often must be diluted prior to incubation or the bacteria will deplete all of the oxygen in the bottle before the test was completed. The main focus of wastewater treatment plants is to reduce theBOD in the effluent discharged to natural waters. Wastewater treatment plants are designed to function as bacteria farms, where bacteria are fed oxygen and organic waste. From the present investigation, the untreated effluents showedBOD of 31.51 mg/L whereas the treated effluents’ was 23.42 mg/L. If effluent with high BOD levels is discharged into a stream or river, it will accelerate bacterial growth in the river and consume the oxygen levels in the river. The oxygen may diminish to levels that are lethal for most fish and many aquatic insects. As the river re-aerates due to atmospheric mixing and as algal photosynthesis adds oxygen to the water, the oxygen levels will slowly increase downstream [20]. The BOD of both treated and untreated effluents were below the standard level.
The COD test determined the oxygen required for chemical oxidation of organic matter with the help of strong chemical oxidant. The COD is a test which is used to measure pollution of domestic and industrial waste. The waste is measured in terms of equality of oxygen required for oxidation of organic matter to produce CO2 and water. It is a fact that all organic compounds with a few exceptions can be oxidizing agents under the acidic condition. COD test is useful in pinpointing toxic condition and presence of biological resistant substances [21]. From Table 2, the COD value for untreated effluents was over the measuring range whereas for treated effluents was 25.3mg/L. Higher COD indicated higher amount of pollution in the wastewater and COD value was always greater than BOD values. The COD test is important to monitor and control the discharge of effluents and for assessing treatment plant performance as impact of effluents or wastewater discharge on river water is predicted by its oxygen demand.
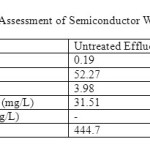 |
Table 2: Chemical Assessment of Semiconductor Wastewater Effluents Click here to View table |
Chlorine dioxide is an extremely effective disinfectant and bactericide, equal or superior to chlorine on a mass dosage basis. Its efficacy has been well documented in the laboratory, in pilot studies and in full-scale studies using potable and wastewater. Unlike chlorine, chlorine dioxide does not hydrolyze in water. Therefore, its germicidal activity is relatively constant over a broad pH range. Chlorine dioxide is as effective as chlorine in destroying coliform populations in wastewater effluents [22]. From Table 2, chlorine dioxide found in untreated effluent was 444.7 mg/L and in treated effluent was 14.7 mg/L. Low amount of chlorine dioxide is important as it acts as a disinfectant and might cause death to living organisms if in high amount.
Atomic Absorption Spectrophotometer (AAS) was used to quantify elements based on the amount of light that they absorb. For flame atomization, the resulting solution was nebulized to form fine droplets that were sprayed into the flame. A complex series of physical and chemical processes occurred to produce free gaseous atoms in the light path of the spectrometer. The amount of light absorbed was proportional to the concentration of the element in the solution. Flame AAS has detection limits at the parts-per-million level or mg/L. Every element absorbed and emit a unique set of wavelengths of light [23]. The heavy metals were elements with atomic weights between 63.5 and 200.5 and a specific gravity greater than 4.0 [17]. Chemical precipitation is most commonly employed for most of the metals. Typically, source reduction and stream segregation were practiced before these streams intermingle with others. Metals were precipitated as hydroxide through the addition of lime or caustic to a pH of minimum solubility.
Based from Table 3, the element of Cd and Cr were absent in both untreated and treated effluents. Cd is a relatively rare element where it was estimated to be present at an average concentration between 0.15 and 0.2 mg kg-1[24]. Cd is chemically very similar to Zn and they usually undergo geochemical processes together [25]. Al, Pb andMn were present together in the untreated effluents but after undergoing treatment, the water had zero value of these three elements. High concentration of Al in irrigation water can be toxic to plants whereas lead as a contaminant in water may come from commercial lead-containing products produced by the semiconductor company which will cause serious health problems to human and aquatic creatures as well. The amounts of Cu, Fe and Zn in the untreated effluents were high compared to the treated effluents. Cu and Fe were among the essential nutrients for plants, animals, and humans but high Cu concentrations are toxic whereas high Fe concentration may cause rusty color and metallic taste but it is not considered toxic. Zn, on the other hand will cause serious poisoning to humans if in high concentration [26].
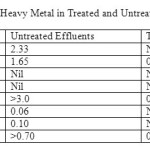 |
Table 3:Concentration of Heavy Metal in Treated and Untreated Wastewater Effluents Click here to View table |
Conclusion
The wastewater quality can be sustained within safe limits for better management of the plant. Industrial wastewater effluents are usually highly variable, with quantity and quality variations brought about by bath discharges, operation start-ups and shut-downs, working-hour distribution and so on. The design of the treatment facility is based on the study of the qualities that must be maintained in the environment to which the wastewater is to be discharged or for reuse of the wastewater and must follow the applicable environmental standards or discharge requirements.
REFERENCES
- Crittenden, J. C. (2005). Canada. John Wiley and Sons, INC.
- Crites, R. W., Reed, S. C., & Bastian, R. K. (2000). USA. McGraw-Hill.
- Chin, D. A. (2006). John Wiley and Sons, INC.
- Vibha Agrawal, S. A. Iqbal and Dinesh Agrawal., Orient. J. Chem., 26(4), 1345-1351 (2010)
- EPA, (1991). 1, 9-91.
- Rahman, A. A. A. (2009). Bachelor Science Thesis. Universiti Malaysia Pahang.
- Barnes, K. H., Meyer, J. L., & Freeman, B. J. (1998).Georgia Water Resources Conference, March 20-22, 1997, the University of Georgia, Athens Georgia
- Needleman, H., (2004). Lead poisoning, Annu. Rev. Med., 55: 209-212.
- Davis, J.M., D.A. Otto, D.E. Weil and L.D. Grant, (1999). Pub. Med – Indexed and MEDLINE, 12(3): 215-29.
- HACH, (2010).Hach Company, Loveland, Colorado, USA.
- HACH, (2009). Hach Company, USA
- Jones, C., Bacon, L., Kieser, M.S., & Sheridan, D. (2006).USA. McGraw-Hill.
- Cech, T. V. (2010).John Wiley and Sons, INC
- Li, Y., & Migliaccio, K. (2011). Wastewater analysis. In Li, Y., & Migliaccio, K. (Eds.), Water Quality Concepts, Sampling, and Analysis, 1, 2-15. USA. CRC Press.
- Kolhe, A. S., & Pawar, V. P. (2011). Recent Research in Science and Technology, 3, 29-32.
- Li, Y., Zhou, M., & Zhao, J., (2011). Laboratory Qualifications for Water Quality Monitoring. In Li, Y., & Migliaccio, K. (Eds.), Water Quality Concepts, Sampling, and Analysis, 7, 137-156. USA. CRC Press.
- Koranteng, A. E. J., Owusu, A. E., Boamponsem, L. K., Bentum, J. K., & Arthur, S. (2011). Pelagia Research Library, 2, 280-288.
- Matani, A. G. (2006).Science Tech Entrepreneur. Retrieved from www.techno-preneur.net/information desk/sciencetech_magazine/
- K. C. Gupta and J. Oberoi., Orient. J. Chem., 26(1), 215-221 (2010).
- Manahan, S. E. (2010).USA. Taylor and Francis group, LLC.
- Makhlough, A. (2008). Unpublished master’s thesis.
- Ahuja, S. (2009). Academic Press, 197-212.
- Wang, L. K., Chen, J. P., Hung, Y. T., & Shammas, N. K. (2010). USA. Taylor and Francis group. LLC.
- Manahan, S. E. (2010). USA. Taylor and Francis group, LLC.
- Pennington, K.L. and Cech, T.V., (2010), Introduction of Water Resources and Environmental Issues, USA University Press.
- Eckenfelder, W. W., Ford, D. L., & Englande, A. J. (2009).137-177. USA. McGraw Hill.

This work is licensed under a Creative Commons Attribution 4.0 International License.
![]()
A New Edition of Web of Science
Journal Impact Factor
2022: 0.5
Five Year: 0.8
Journal is Indexed in

Cabells Whitelist
![]()


