Microcalorimetric Study of the Catalytic Properties of SBA-15 Modified with Cu or Fe for Adsorption/Oxidation of methyl mercaptane
Liliana Giraldo1, Maria Fernanda Gonzalez-Navarro2, Juan Carlos Moreno-Pirajan2*
1Facultad de Ciencias, Departamento de Química, Universidad Nacional de Colombia, Bogotá, Colombia 2Facultad de Ciencias, Departamento de Química, Grupo de Investigación en Sólidos Porosos y Calorimetría, Universidad de los Andes, Bogotá, Colombia
DOI : http://dx.doi.org/10.13005/ojc/290405
Article Received on :
Article Accepted on :
Article Published : 26 Dec 2013
SBA-15 modified with Cu or Fe was used for adsorption/oxidation of methyl mercapthane in the vapour phase. These solids were synthesized from SBA-15 using the template method with a non-ionic surfactant and impregnating the SBA-15 with Cu and Fe. The solids were characterized by using XRD, FTIR and isotherms of adsorption in N2. An increase in the surface area, pore volume and mesoporosity of the SBA-15 with each metal was observed. Adsorption microcalorimetry is an effective method to measure thermal effects generated during the decomposition of methyl mercapthane.
KEYWORDS:Adsorption microcalorimetry; methyl mercapthane; isotherms; SBA-15.
Download this article as:| Copy the following to cite this article: Giraldo L, Gonzalez-Navarro M. F, Moreno-Pirajan J. C. Microcalorimetric Study of the Catalytic Properties of SBA-15 Modified with Cu or Fe for Adsorption/Oxidation of methyl mercaptane. Orient J Chem 2013;29(4) |
| Copy the following to cite this URL: Giraldo L, Gonzalez-Navarro M. F, Moreno-Pirajan J. C. Microcalorimetric Study of the Catalytic Properties of SBA-15 Modified with Cu or Fe for Adsorption/Oxidation of methyl mercaptane. Orient J Chem 2013;29(4). Available from: http://www.orientjchem.org/?p=1233 |
INTRODUCTION
Sulfur compounds are well known as a problem affecting not only the environment but also human health. Thus, in recent decades research centers dedicated to proposals to protect the environment and public health have focused their efforts on proposing fast, efficient and economic solutions to solve this problem. As we wrestle with this problem, it is worth mentioning that hydrogen sulfide (H2S) is found naturally in petroleum, natural gas, volcanic gases and hot springs. H2S is released primarily as an environmental gas and can be transformed into sulfur dioxide (SO2) and sulfuric acid (H2SO4), contributing to the formation of acid rain. H2S causes problems in the handling and processing of natural gas due to its high toxicity and corrosiveness, formation of sulfur dioxide (SO2) (highly toxic and corrosive during combustion), and decreased gas calorific value, promoting the production of hydrates; sulfur compounds such as mercaptans (RSR), carbonyl sulfide (SCO) and carbon disulfide (CS2) also have unpleasant odors, so it is necessary to remove them from natural gas to levels that ensure the health and environment1-3. Currently, chemical absorption processes are generally used to removing H2S from natural gas, with amine, MEA (monoethanolamine) being the oldest and best known process4,5. All the alkanolamines used are strongly carcinogenic and their application as aldehydes (formaldehyde, acrolein) is undesirable. Studies have been on the removal of H2S on Cu impregnated carbons, or coal sludge derived from mixtures of carbon and clays impregnated with Fe, Cu or Zn; zeolite 13X Zinox 380 (88% ZnO), ZnO and CuO nanoparticles on SBA-15 have proven to be appropriate solids for removing H2S2,4. Various studies show that clays modified with metal cations such as iron, copper and zinc improve the H2S adsorption capacity due to the ease of forming sulfides6,7. At present there are no studies on H2S removal using surfactant-modified mesoporous materials, either exchanged or impregnated with metals. Therefore, the objective of this investigation was to assess the ability of mesoporous solids prepared from a natural clay to remove H2S.
Within the family of mercapthans, one of the more toxic is methyl mercapthan. Methyl mercapthan (CH3SH) is a highly odorous and volatile compound emitted to the atmosphere; the presence of only a very small amount of CH3SH in air (minimum odor threshold about 5 ppm) makes us uncomfortable. The removal of CH3SH from air is important for our comfort. To remove methyl mercapthan from air, activated carbons are widely applied as effective adsorbents8-11. In these applications of activated carbons, methyl mercapthan is physically or chemically adsorbed on the activated carbons. In general, the adsorption of organic compounds by activated carbons is largely influenced by pore characteristics such as pore size, distribution, morphology and surface properties. Because the methyl mercapthan molecule is small in size, surface properties and pore characteristics are supposed to play an important role in the adsorption of methyl mercapthan. On the other hand, it was reported that oxidation of methyl mercapthan to dimethyl disulfide takes place at the surface of activated carbons having functional groups such as carboxyl group in dry/wet air12-14. In addition, there are a few reports on the adsorption/oxidation of methyl mercapthan on surface-modified activated carbons15-17. Among current problems the most studied is natural gas, a vital component of the world’s supply of energy. It is one of the cleanest, safest, and most useful of all energy sources. Because natural gas generated energy provides the means for day-to-day needs and activities, and energy production from fossil fuel has detrimental effects on the environment, countries in America and Europe have been developing improved natural gas power systems that are cleaner and more fuel efficient, namely, fuel cells18,19. Fuel cells are expected to play a major role in these countries’ energy future. They are pollution-free power sources capable of on-site power generation. Since there is no combustion, there is no emission of the pollutants commonly produced by boilers and furnaces. For fuel cell application, natural gas is converted to H2 and CO in a steam-reforming reactor, which yields the highest percentage of hydrogen19-21. Natural gas fuel contains naturally occurring reduced sulfur compounds such as hydrogen sulfide, mercapthans and tetrahydrothiophene. These compounds, due to their ability to poison the catalyst, are detrimental to subsystems within the fuel processor and to the fuel cell stacks, and so must be completely removed from the fuel prior to the fuel reforming operation18.
On the other hand, a novel and highly sensitive thermodynamic technique has not been used in this field of research. Adsorption microcalorimetry has long been used in different areas of chemistry, but mainly in catalysis22. For example, many microcalorimetric studies have dealt with the adsorption of basic molecules (e.g. NH3) on zeolites and metal oxide catalysts to probe the strength of acid sites23. In contrast, microcalorimetry has only been used to a lesser extent to probe sites on metal-based catalysts, since reduced metal surfaces might be more susceptible to poisoning by trace oxygenates (e.g. O2, H2 O, CO and CO2) present in high-vacuum systems. Thus, it is often difficult to prepare clean metal surfaces and maintain them in a zero-valence state for microcalorimetry. New advances in adsorption microcalorimetry have made it possible to measure differential heats of adsorption on single metal crystals22,23, polycrystalline metal films24,25, and metal powders and metal based catalysts that are reactive towards oxygenates26. Microcalorimetry has been used effectively to probe sites on supported metal catalysts (e.g. Pt/SiO2) that are not overly sensitive to poisoning by oxygenates. However, this sensitive technique has not yet been explored as a tool to determine the heats of adsorption/decomposition in situ on mesoporous solids, important data if you want to use a pilot plant employing solid catalyst beds for mesoporous decomposition reactions, because it is necessary to establish the amount of energy released during the process22,27.
In this paper we investigated the adsorption/oxidation of methyl mercapthan on catalyst SBA-15 with particles of Cu and Fe. The effects of these metals on the catalytic activities are also discussed. The effects of these particles on the pore structure of the SBA-15 and the capacity to adsorb methyl mercapthan were also analysed. SBA-15, copper and iron were impregnated and characterized by nitrogen adsorption, XRD, and FTIR. Catalytic studies were performed by determining the breakthrough curves and, in a new development, the energy released during the adsorption of methylmercapthane on the catalysts was measured with adsorption microcalorimery. SBA-15 was chosen as the catalyst support in consideration of its large pore size, high surface area and hydrothermo-stability.
EXPERIMENTAL
Chemicals
The chemicals used in this study included triblock copolymer poly(ethylene oxide)-poly(propylene oxide)-poly(ethylene oxide), Pluronic P123 (MW: 5800, Aldrich, St. Louis, MO, US), tetraethyl orthosilicate (TEOS, 98%, Aldrich), hydrochloric acid (Merck), 3-aminopropyltriethoxysilane (APTES, Aldrich), hydrated copper nitrate (J.T. Baker) and hydrated iron nitrate (Merck).
Synthesis of SBA-15
A sample of SBA-15 was prepared according to the methodology described by Zhao28. Eight grams of Pluronic P123 were dissolved in an aqueous solution of 2.5 M HCl using a tricblock copolymer as organic template. The temperature of the solution was raised to 50 °C and next TEOS was added drop by drop to the system as the silica source while stirring vigorously for 15 minutes. The stirring rate was then lowered and kept at this rate for 24 hours. Subsequently, the reaction mixture was heated to 85°C for 48 hours. The resulting white precipitate was separated from the liquid phase by filtering and further washed with deionized water. Finally, the polymer was removed by calcination in air at 550°C for 12 hours. The nominal molar composition for this synthesis was: 0.045 TEOS: 7.09 H2O:0.37 HCl:0.0008 P123. SBA-15 was used as the carrier of the catalysts.
Synthesis of catalyts with Cu and Fe on SBA-15
An impregnation method was introduced to load Cu and Fe on SBA-15. Cu(NO3)2.9H2O and Fe(NO3)3, .9H2O were selected as precursors of copper and iron elements, respectively. The precursors were dissolved in deionized water at a concentration dependent on the desired metal loading. A certain amount of SBA-15 was dispersed into the above solutions by ultrasonic vibration, and then the mixture was evaporated and dried thoroughly at room temperature. After impregnation, the acquired powders were calcined at 550°C again for 12 h to obtain the final catalysts. These catalysts are denoted as Cu/SBA-15 and Fe/SBA-15, respectively.
Characterization of samples
Adsorption of nitrogen
Isotherms were used with the BET (Brunauer, Emmett and Teller) model29 to calculate the specific surface areas obtained from the nitrogen adsorption experiments measured at -196 °C after degassing the samples below 10–6 Torr at 150 °C overnight using an IQ2 (Quantachrome Inc., Boynton Beach, USA) unit. The pore size distribution was determined from the desorption branch of the isotherm by the BJH (Barrett-Joyner-Halenda) method [30]. The total pore volume was calculated as the amount of nitrogen adsorbed at a relative pressure of ca 0.99. Pore wall thickness was calculated as: Pore wall thickness = d(100)*2/√3 pore diameter, where d(100)*2/√3 represents the unit cell parameter and d(100) is the d-spacing value of the (100) diffraction peak in the XRD pattern of each sample.
DRX and FTIR
The crystallographic structure was also determined by analyzing the X-ray powder diffraction taken with a PW 1830 diffractometer (Rigaku PDLX, Japan), using a monochromatized X-ray beam with nickel-filtered CuKα radiation (λ = 0.154021 nm). The average crystallite size was evaluated according to Scherrer’s equation. In addition, Fourier Transform Infrared Spectroscopy (FTIR) was used to study each of the samples obtained. The functional groups present in the SBA-15 were determined using a NICOLET® NEXUS 470 spectrophotometer.
Catalytic tests: determination of breakthrough curves
To evaluate the capacity of the synthesized samples, catalytic experiments were carried out in the adsorption/oxidation dynamic phase similar to those reported in the literature3,5,7,11,13-18 in order to make comparisons with our results. The design was adjusted to our laboratory conditions. Dynamic tests were carried out at 25 ◦C to evaluate the decomposition and adsorption capacity of methyl mercapthan on the synthesized samples. A sample of 0.1 g was placed in the center of a glass column (size of particle: of 1-2 mm) and packed into a glass column (length: 310 mm; internal diameter: 10.5 mm; bed volume: 8 cm3). The column was placed in an electric furnace with an automatic temperature controller. A K-type thermocouple was inserted in the sample. Before the start of the experiment, the sample was purged at 100 ◦C for 1 h with a nitrogen flow of 100 mL/min. Methyl mercapthan in N2 (200 ppm) was used as an adsorbate without further purification and the adsorbate was passed through the column of sample at 15 mL/min. A mass flow controller was used for the control the adsorbate flow11. The inlet and outlet concentrations of the adsorbate were measured by gas chromatography with an FID detector (Shimadzu 2014). The amount of methyl mercapthan adsorbed was calculated directly from the breakthrough curves8,9. The CH3SH test was repeated at least twice for each sample.
Adsorption microcalorimetric measurements
The differential heats of methyl mercapthan adsorption were measured using a Tian-Calvet heat flow microcalorimeter built in our laboratory22, 33-36. Before performing injections into the microcalorimetry cell where the catalysts were placed (Cu/SBA-15 and Fe/SBA-15), the catalysts were evacuated to 10-6 Pa. Then, the microcalorimeter heat sink was subsequently raised around the cell and the system was allowed to equilibrate overnight. A schematic diagram of the microcalorimetric system is shown in Fig. 1. The microcalorimeter is capable of operating at temperatures from 77 to 573 K. This microcalorimeter is connected, by means of a specially designed set of calorimeter cells, to a volumetric system equipped with a vacuum system (dynamic vacuum of 10-5 Pa), a gas handling system with probe molecule reservoir, and a calibrated dosing volume employing Pfeiffer transducer manometers (± 1.9×10⁻⁵ Pa). The leak rate of the volumetric system is 10-3 Pa/min in a system volume of approximately 70 cm3 (i.e. 10-4 μmol.min-1). In this model, we modified the microcalorimetric cells and had them built in quartz by a specialist to avoid interactions of methyl mercapthan with the metals with which these cells are usually constructed. These cells measure about 25 cm long and about 6 mm wide. Two identical receptacles of the same material are connected to the ends of each cell’s stems with modified Cajon VCR fittings. The length (10 cm), diameter (5 mm), and distance apart (12 cm) of these receptacles were chosen to match the depth, diameter, and spacing of the transducer wells in the microcalorimeters (Fig. 1). The calorimetric cell containing the sample as well as two diffusers is placed along each of the cell stems to minimise convective air currents within the transducer well. A quartz holder near the top of the stems, equipped with Viton O-rings, provides a seal between the cell’s stems and transducer wells, and serves to isolate the cell in the calorimeter33-36.
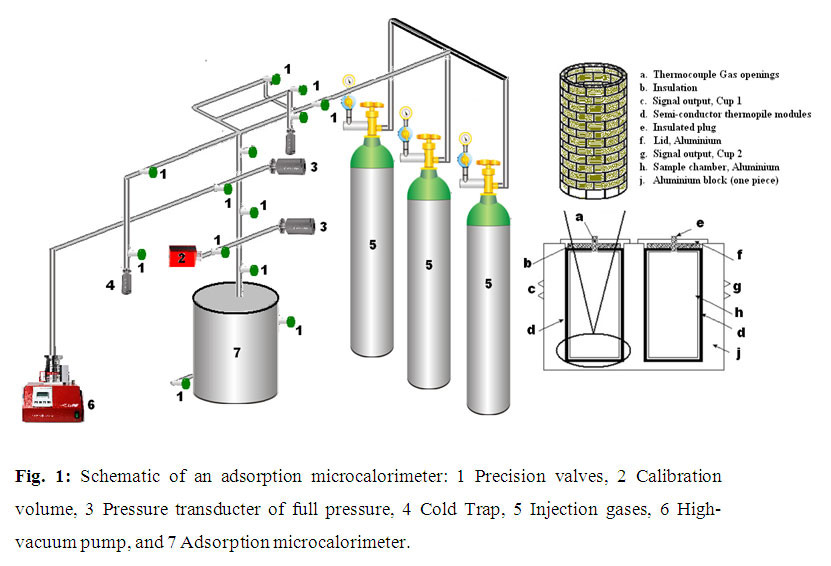 |
Fig. 1: Schematic of an adsorption microcalorimeter: 1 Precision valves, 2 Calibration volume, 3 Pressure transducter of full pressure, 4 Cold Trap, 5 Injection gases, 6 High- vacuum pump, and 7 Adsorption microcalorimeter. Click here to View figure |
The upper portion of each cell is fitted with a MDC bellows-sealed linear motion feed fixed to the top of the cell using standard, copper-gasketed, 0.5 inch outside diameter vacuum flanges (MDC). A system of precision valves allows dosing of the respective amounts of gases. In a typical experiment, a measured mass of catalyst (typically 0.5–2.0 g) is loaded into the glass cell, followed by purging with helium (ca. 4 h) at an elevated temperature to remove the adsorbed gases, cooling to room temperature in flowing helium, and subsequent evacuation to ca. 1×10⁻⁵ Pa. The sample is then transferred into the quartz cell, which is subsequently immersed in the heat sink. The cells are evacuated to ca. 1×10⁻⁵ Pa and allowed to reach thermal equilibrium with the calorimeter (ca. 5–6 h), at which point a stable differential heat response (baseline) is achieved. The microcalorimetric measurements are initiated when doses of the methyl mercapthane (dosages ca. 10–30 μmol) are sequentially admitted to the catalyst (Cu/SBA-15 and Fe/SBA-15) until it becomes saturated or the reaction with methyl mercapthan ends. The resulting heat response for each dose is recorded as a function of time and subsequently integrated to determine the amount of heat generated (mJ). The amount of gas adsorbed (μmol.g-1) is determined volumetrically from the dose and equilibrium pressures, and the system volumes and temperatures. The differential heat (kJ.mol-1), defined as the negative of the enthalpy change in adsorption per mole of gas, is then calculated for each dose by dividing the heat generated by the amount of gas adsorbed33-36.
RESULTS AND DISCUSSION
Characterization of the SBA-15 and catalysts
The textural properties of the SBA-15, Cu-SBA-15 and Fe-SBA-15 synthesized samples were studied by nitrogen adsorption isotherms. The isotherms investigated are shown in Fig. 2a. The samples exhibited type IV isotherms, according to IUPAC classification, featuring a narrow step due to capillary condensation of N2 in the primary mesopores37. Filling of the mesopores of the SBA-15, Cu-SBA-15 and Fe-SBA-15 materials occurred at P/Po = 0.65–0.96, which was reflected as a steep increase in the isotherm. All isotherms exhibited an H1-type hysteresis loop that was mainly due to the capillary condensation and desorption of nitrogen, which strongly suggests the presence of large mesopores in the Cu-SBA-15 materials. The typical BJH pore size distributions (Fig. 2b) indicate narrow pore size distributions for the samples, which become broader with increasing copper content, attributed to particles within the mesopores narrowing the mesoporous channels.
As shown in Table 1, the surface area of the SBA-15 support was reduced to some degree after doping with the active metals (Cu and Fe), suggesting the metal particles were incorporated into the mesoporous channels and possibly deposited at the mouths of the SBA-15 channels. Additionally, it was also found that a drop in the pore size and a rise in the wall thickness occurred simultaneously with the addition of the active components. These findings offer further evidence that some metal species are confined inside the SBA-15 channels.
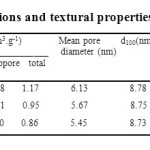 |
Table 1: Chemical compositions and textural properties of the samples synthesized. Click here to View table |
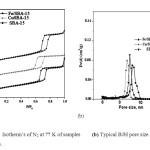 |
Fig 2: (a) Isotherm’s of N2 at 77 K of samples Fig 2: (b) Typical BJH pore size distributions of samples. Click here to View figure |
Characterization of synthesized samples with XRD and FTIR
In order to establish the structure characteristics of the synthesized samples, XRD and FTIR studies were performed. The small angle XRD patterns of the SBA-15, Cu/SBA-15 and Fe/SBA-15 materials are shown in Fig. 3. For the SBA-15 sample, three well-resolved peaks at (100), (110), and (200) can be clearly seen in the range of 2θ = 0.5–2.5°, which correspond to the well-ordered hexagonal mesoporous structure. The (210) peak is too weak to be recognized, probably due to the incorporation of heteroatoms (Cu and Fe) into the framework of SBA-15, which may cause a decrease in the ordered structure38,39. Therefore, it is clear that the intensity of these peaks decreased when the Cu and Fe were added to the SBA-15, showing that this has a negative effect on its structure.
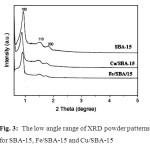 |
Fig. 3: The low angle range of XRD powder patterns for SBA-15, Fe/SBA-15 and Cu/SBA-15 Click here to View figure |
The other bands in the FT-IR spectra of the various samples synthesized (SBA-15, Cu/SBA-15 and Fe/SBA-15) are given in Fig. 4. For pure silica SBA-15, the bands at 1120 cm-1 and 800 cm-1, assigned to an anti-symmetric stretching vibration and the symmetric stretching vibration of [SiO4] in SBA-1540,41, shift to lower wavenumbers as heteroatoms are introduced, while the band at 490 cm-1, assigned to the rocking vibration of [SiO4]40-44, is unchanged. The same phenomenon has also been reported in metal-substituted mesoporous materials42, indicating a strong interaction between heteroatoms and silicon; for example, Si–O–M bonds can be formed.
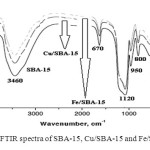 |
Fig. 4: FTIR spectra of SBA-15, Cu/SBA-15 and Fe/SBA-15 Click here to View figure |
These changes have been related by various authors to the incorporation of Cu and Fe atoms into the SBA-15 framework. The band at ca. 990 cm-1, assigned to a stretching vibration of a [SiO4] unit bonded to heteroatoms, may be evidence of the existence of framework metal ions40. However, silanol groups ν(Si–OH) in pure mesoporous silica materials can also contribute to this band39. Therefore, there is some dispute over the assignment of the band at 990 cm-1 40-43. In order to solve the problem of the assignment, it is necessary to measure the IR spectra in situ at elevated temperatures. According to previous research40, the intensity of the band (970 cm-1) for Si–OH decreased and disappeared completely by increasing the temperature, while in the case of Si–O–M this band did not disappear at elevated temperature. However, experiments performed by other authors have shown that at elevated temperatures the band at 990 cm-1 in the IR spectra of Cu-SBA-15 gradually disappears with increasing temperatures and thus is assigned to Si–OH groups. Therefore, the band at 990 cm-1 cannot be taken as proof of metal ion incorporation into the framework of SBA-15. The same argument can be used for other metals, including Fe.
Catalytic activity of Fe/SBA-15 and Cu//SBA-15 sample
Fig. 5 shows the breakthrough curves for methyl mercapthan on Fe/SBA-15 and Cu/SBA-15. The reacted and adsorbed amounts of methyl mercapthan for the samples synthesized in this work can be calculated using the breakthrough curves. The results are presented in Fig. 5.
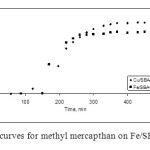 |
Fig. 5: Breakthrough curves for methyl mercapthan on Fe/SBA-15 and Cu/SBA-15. Click here to View figure |
Based on the breakthrough times, the performances of the catalyst differ significantly. Methyl mercapthan adsorption capacities for the samples are presented in Fig. 5. The greatest amount adsorbed was found for the Fe/SBA-15 catalyst, even though the breakthrough test had to be stopped at 35 ppm due to the fact that the strongly catalytic nature of this catalyst facilitates rapid oxidation of MM to dimethyl disulfide (DMDS), which is not detected by the sensor used in our experiments; this had already been reported by other authors11,14-18. The capacity of the Cu/SBA-15 catalyst was less. To understand what governs the process of MM adsorption on the catalyst samples, a deeper insight into the nature of the SBA-15 under investigation and the surface features that lead to the differences in their capacities is needed. One explanation for why the catalytic capacity of the catalyst with iron is higher with respect to the copper catalyst is due to differences in the textural properties of the SBA-15. Greater surface area allows greater diffusion of methyl mercapathan within the crystal lattice, and thereby the occurrence of a faster reaction and subsequent adsorption process.
Some authors have suggested some interesting reactions to explain the influence of iron in these catalysts; these reactions are interesting and should be considered in explaining the process of decomposition of methyl mercapthan13,14.
CH3SH → CH3S– + H+
Fe3+ + CH3S– → Fe2+ CH3S
2CH3S• → CH3SSCH3
Fe2+ + O2 + H+ → Fe3+ + HO2
CH3S– + HO2 → CH3S + HO2–
HO2– + H+ → H2O2
2CH3SH + H2O2 → 2CH3S + 2H2O
As can be seen from the above listed reactions, the role of iron is to promote formation of thiolate radicals and reduction of oxygen, resulting in the presence of very active superoxide species that go on to form radicals under either wet or dry conditions in the MM removal process14-18.
Adsorption calorimetry analysis
Typical pulse data for methyl mercapthane on Fe/SBA-15 are shown in Fig. 6. The signals for each pulse are recorded when a quantity of methyl mercapthane is injected onto the catalyst. If no adsorption/oxidation of methyl mercapthane occurs in the samples of Cu/SBA-15 and Fe/SBA-15 (not shown here for Cu/SBA-15), a flat baseline is recorded. The adsorption/oxidation appears as a peak above the baseline.
Complete adsorption/oxidation (catalyst depletion) of the catalyst under the experimental conditions can be easily detected from the pulse data as described earlier, when the signal of adsorption microcalorimeter output returns to its baseline. While following the adsorption/oxidation phenomena, exothermic peaks in the adsorption microcalorimeter output were observed, as shown in Fig. 6. The extent of irreversible reaction decreased gradually with subsequent pulses and the corresponding heat release also showed this decreasing trend up to the seventh pulse. The amount of methyl mercapthane adsorbed per gram of the catalyst up to this stage roughly corresponded to the sites with acidic character in the catalysts47-50. Starting from the ninth pulse each adsorption event was followed by desorption of reversibly adsorbed methyl mercapthan and corresponding endothermic peaks were seen in the adsorption microcalorimetry thermal curves. From the 11th pulse onwards, all methyl mercapthane adsorption was essentially reversible. Throughout the experiment, the exothermic peak for methyl mercapthane adsorption during each pulse was preceded by a small endotherm in the pulse thermal curve (Fig. 6).
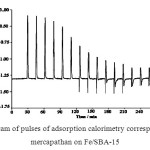 |
Fig. 6: Thermogram of pulses of adsorption calorimetry corresponding to methyl mercapathan on Fe/SBA-15 Click here to View figure |
These results clearly show that the chemical process is carried out within the network of the catalysts synthesized. In the initial portion, clearly exothermic processes are associated with the oxidation of methyl mercapthan. The reactions, which have been widely disseminated and analysed, are illustrated below:
Step (1) 2RSH + 2FeO → RSSR + Fe2O + H2O
Step (2) 2RSH + 2Fe2O → 2RSFe + H2O
where, in the first step, reduction/oxidation occurs between the thiol of the methyl mercapthan and FeO to form a disulfide and iron (I) oxide.
The reaction continues as the thiol reacts with the surface iron(I) oxide to form iron(I) thiolate. A similar chemistry occurs between the surface of the copper metal and thiol according to the following reaction where, in this case, the copper metal serves as a reducing agent to liberate H2:
2RSH + 2Fe → 2RSFe + H2
During the process of adsorption, at the end of the process (after finishing the oxidation process) it is well known that thiols will self-assemble into strictly arranged monolayers (commonly known as SAMs) on the surface of coinage metals, especially gold, silver, copper and iron. These SAMs have been intensely researched and are of great interest due to the unique properties of the resulting surfaces, including stabilization and passivation to electrochemistry and other reactions. While much of the study of copper/thiol and iron/thiol chemistry has been restricted to the formation and properties of SAMs, it has been shown that multilayers can form into independent lamellar structures.
In the second part of the adsorption microcalorimetry, when small endothermic peaks appear, it is clear that the decomposition of methyl mercapthan has finished and the process of adsorption/desorption onto the catalysts is the predominant one. This is a new and interesting finding, that with this technique it is possible to quantify and establish when the thermal effect of this interesting catalytic phenomenon appears.
Therefore, the main contribution of the present work is the use of an adsorption microcalorimeter built in our laboratory to measure the heat adsorption of methyl mercapthan onto two different SBA-15 surfaces modified with great precision. The differential molar enthalpy of adsorption (ΔadsH) was determined from the thermal effect of the successive injections of the adsorbate into the calorimetric cell containing the Cu/SBA-15 and Fe/SBA-15 particles. Is necessary to let the signal fully equilibrate so as to avoid introducing errors in each step and therefore subsequently in the calculations (Fig. 7.).
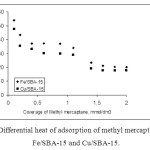 |
Fig. 7: Differential heat of adsorption of methyl mercapthan over Fe/SBA-15 and Cu/SBA-15. Click here to View figure |
The difference shown in the graph between the first drop in the enthalpy and the first plateau reached corresponds to what we have called the Δox-adsH oxy-ads of methyl mercapthan enthalpy.
All Δox-adsH values collected that are shown in Fig.7 are negative, indicating that this process is an exothermic, energetically favourable process. For the two catalysts studied, the drastic decrease in Δox-adsH corresponds to methyl mercapthan descomposition. A comparison between the adsorption enthalpies of the catalysts synthesized shows that the Cu/SBA-15 is less exothermic with respect to the Fe/SBA-15.
These results are in very good agreement with the textural properties found in this study and the catalystic results, where the catalyst with the larger superficial surface area (Fe/SBA-15) produces greater thermal effects, which are associated in these mesoporous solids with the properties of these solids. This shows that the Fe/SBA catalyst achieves higher methyl mercapathan oxidation capacity and, subsequently, when the catalyst is spent, the mesoporous solid begins to adsorb the methyl mercapthan, allowing a double function: methyl mercapthan decomposition and adsorption. The results of the microcalorimetry experiments show that the heats of adsorption generated over a mesoporous catalyst modified with Cu and Fe show thermodynamic values associated with each phase of the process that takes place within the catalyst network.
CONCLUSIONS
The catalysts were characterized by their FTIR XDR patterns, effectively demonstrating that they corresponded to these samples. Further tests were carried out establishing catalytic activity breakthrough curves and it was found that the iron catalyser has greater activity.
A significant contribution to the study of the adsorption/oxidation of methyl mercapthan onto Cu/SBA-15 and Fe/SBA-15 at the solid–gas interface was the determination of the differential molar enthalpy of adsorption under the same physicochemical conditions as those applied during the adsorption isotherm measurements. The profile of an enthalpy curve is complex because various adsorption/oxidation mechanisms are present successively or simultaneously. The successive steps in adsorption can be identified and differentiated owing to calorimetric investigation. Moreover, the chemical state of the Cu/SBA-15 and Fe/SBA-15 surface is very important and determines the shape of the interfacial aggregates at the end of the adsorption process.
ACKNOWLEDGEMENTS
The authors thank the Departments of Chemistry of the Universidad Nacional de Colombia and the Universidad de los Andes (Colombia) and the Master Agreement established between these institutions. Special gratitude is expressed to the Vice-rectoría de Investigaciones and the Facultad de Ciencias of the Universidad de Los Andes (Colombia) for its financing of this research.
REFERENCES
- Semprún L, Solano R, Sánchez J, Carruyo G, Ramos M. A, Enao J.A, Atencio R, Bandosz T, Seredych M, Moronta A. Removal of H2S using a natural clay modified with a surfactant and incorporating Cu, Fe. Revista Tecnica de la Facultad de Ingenieria Universidad del Zulia. 34: 66-76 (2011).
- Zhao L, Wang Y, Jin L, Qin M, Li X, Wang A, Song C, Hu Y, Decomposition of hydrogen sulfide in non-thermal plasma aided by supported CdS and ZnS semiconductors, Green Chemistry, 15:1509-1513 (2013).
- Bandosz T, On the Adsorption/Oxidation of Hydrogen Sulfide on Activated Carbons at Ambient Temperatures. Journal of colloid and Interface Science. 246 (1): 1-20 (2002).
- Campbell J.M, “Gas Conditioning and Processing”. Chapter 20, John M. Campbell and Co. International Petroleum Institute Ltd. Norman. Okla, 2nd Edition, USA. (1968).
- Bagreev A, Bandosz T, H2S Adsorption/Oxidation on Materials Obtained Using Sulfuric Acid Activation of Sewage Sludge-Derived Fertilize. Journal of Colloid and Interface Science. 252 (1): 188-194 (2002).
- Nguyen-Thanh D, Bandosz T, Effect of Transition-Metal Cations on the Adsorption of H2S in Modified Pillared Clays. The Journal of Physical Chemistry B. 107 (24): 5812-5817 (2003).
- Nguyen-Thanh D, Bandosz T, Activated carbons with metal containing bentonite binders as adsorbents of hydrogen sulphide. Carbon. 43 (2): 359-367 (2005).
- Tamai H, Nagoya H, Shiono T, Adsorption of methyl mercaptan on surface modified activated carbon. Journal of Colloid and Interface Science. 300 (2): 814–817 (2006).
- Tanada S, Boki K, Matsumoto K, Adsorption Properties of Methyl Sulfide and Methyl Disulfide on Activated Carbon, Zeolite, and Silicate, and Their Porous Structure. Chemical and Pharmaceutical Bulletin. 26 (5): 1527-1531 (1978).
- Katoh H, Kuniyoshi I, Hirai M, Shoda M, Studies of the oxidation mechanism of sulphur-containing gases on wet activated carbon fibre. Applied Catalysis B: Environmental. 6 (3): 255-262 (1995).
- Kim D. J, Yie J.E, Role of copper chloride on the surface of activated carbon in adsorption of methyl mercaptan. Journal of Colloid and Interface Science. 283 (2): 311-317 (2005).
- Dalai A.K, Tollefson E.L, Yang A, Sasaoka E, Oxidation of Methyl Mercaptan over an Activated Carbon in a Fixed-Bed Reactor. Industrial and Engieneering Chemistry Resesearch. 36 (11): 4726-4732 (1997).
- Bashkova S, Bagreev A, Bandosz T.J, Adsorption of Methyl Mercaptan on Activated Carbons. Environmental Science and Technology. 36 (12): 2777-2782 (2002).
- Bagreev A, Bashkova S, Bandosz T.J, Dual Role of Water in the Process of Methyl Mercaptan Adsorption on Activated Carbons. Langmuir 18 (22): 8553-8560 (2002).
- Bashkova S, Bagreev A, Bandosz T.J, Effect of Surface Characteristics on Adsorption of Methyl Mercaptan on Activated Carbons. Industrial and Engieneering Chemistry Resesearch. 41 (17): 4346-4354 (2002).
- Bashkova S, Bagreev A, Bandosz T.J, Adsorption/Oxidation of CH3SH on Activated Carbons Containing Nitrogen.Langmuir. 19 (15): 6115-6122 (2003).
- A. Bagreev, J.A. Menendez, I. Dukhno, Y. Tarasenko, T.J. Bandosz, Oxidative adsorption of methyl mercaptan on nitrogen-enriched bituminous coal-based activated carbon, Carbon, 43(1): 208-210 (2005).
- Bashkova S, Bagreev A, Bandosz T. J, Catalytic properties of activated carbon surface in the process of adsorption/oxidation of methyl mercaptan. Catalysis Today. 99 (3-4): 323–328 (2005).
- Blok K, Williams R.H, Katofsky R.E, Hendriks C.A, Hydrogen production from natural gas, sequestration of recovered CO2 in depleted gas wells and enhanced natural gas recovery. Energy. 22 (2-3): 161-170 (1997).
- Otero C, Bonelli B, Rodriguez M, Garrone E, Hydrogen storage via physisorption: the combined role of adsorption enthalpy and entropy, Turk. J. Chem, 33: 599-606 (2009).
- Clarke S.H, Dicks A.L, Pointon K, Smith T.A, Swann A, Catalytic aspects of the steam reforming of hydrocarbons in internal reforming fuel cells. Catalysis Today. 38 (4): 411-422 (1997).
- Moreno-Piraján J. C, Garcia-Cuello V. S, Giraldo L, Characterization of Mordenite-Supported Pd, Pt, and Ir Determined by CO Adsorption Microcalorimetry and the Dehydrogenation Reaction of C3 Alkanes. Topics in Catalysis. 54: 146–152 (2011).
- B.E. Spiewak, R.D.Cortright, J.A.Dumesic, (1997) In: Ertl G, Knoezinger H, Weitkamp J (eds), Handbook of Heterogeneous Catalysis, vol. A. Wiley-VCH Verlag GmbH, Weinheim, Germany.
- S.Dutour, J.Nokerman, S.Limborg-Noetinger, M.Frere, Simultaneous determination of mass and calorimetric adsorption data of volatile organic compounds on microporous media in the low relative pressure range.Measurement Science and Technology. 15 (1): 185–194 (2004).
- Neuhoff P.S.,Wang J, Isothermal Measurement of Heats of Hydration in Zeolites by Simultaneous Thermogravimetry and Differential Scanning Calorimetry,Clays and Clays Minerals, 55(3): 239-252 (2007).
- Kovaar M, Dvoraak L, Cerny L, pplication of pyroelectric properties of LiTaO3 single crystal to microcalorimetric measurement of the heat of adsorption. Applied Surface Science. 74 (1): 51–59 (1994).
- Dvoraak L, Kovaar L, Cerny S, A new approach to adsorption microcalorimetry based on a LiTaO3 pyroelectric temperature sensor and a pulsed molecular beam. Thermochimica Acta, 245: 163–171 (1994).
- Zhao D, Feng J, Huo Q, Melosh N, Fredrickson G.H, Chmelka B.F, Stucky G.D, Triblock copolymer syntheses of mesoporous silica with periodic 50 to 300 angstrom pores. Science. 279: 548–552 (1998).
- Brunauer S, Emmett P. H, Teller E, Adsorption of Gases in Multimolecular Layers. Journal of the American Chemical Society. 60 (2): 309-321 (1938).
- Barrett E.P, Joyner L.G, Halenda P.P, The Determination of Pore Volume and Area Distributions in Porous Substances. I. Computations from Nitrogen Isotherms. Journal of the American Chemical Society, 73 (1): 373–380 (1951).
- Cortright R. D, Dumesic J. A, Effects of Potassium on Silica-Supported Pt and Pt/Sn Catalysts for Isobutane Dehydrogenation. Journal of Catalysis. 157 (2):576–584 (1994).
- Wei Y, ZhangD, Liu Z, Suj B.L., Methyl Halide to Olefins and Gasoline over Zeolites and SAPO Catalysts: A New Route of MTO and MTG, Chinesse J. Catal. 33(1) 11-21(2012).
- Moreno-Piraján J.C, Giraldo L, Sapag K, Zgrablich G, Garcia-Cuello V.S, Adsorption micro calorimeter. Journal of Thermal Analysis and Calorimetry. 97 (2): 711–715 (2009).
- Moreno-Piraján J.C, Giraldo L, Sapag K, Zgrablich G, Garcia-Cuello V.S, Variation of the noise levels in the baseline of an adsorption microcalorimeter. Journal of Thermal Analysis and Calorimetry, 97 (2): 705–709 (2009).
- Moreno-Piraján J.C, Giraldo L, Garcia-Cuello V.S, Sapag K, Zgrablich G, A new microcalorimeter of adsorption for the determination of differential enthalpies. Microporous and Mesoporous Materials. 120 (3): 1387–1811(2009).
- Moreno-Piraján J.C, Giraldo L, Sapag K, Garcia-Cuello V.S, Analysis of the Response of Thermal Sensors in Adsorption Microcalorimetry. International Review of Chemical Engineering. 1 (3): 250-262 (2009).
- Sing K.S.W, Everett D.H, Haul R.A.W, Moscou L, Pierotti R.A, Rouquérol J, Siemieniewska T, Reporting Physisorption Data for Gas/Solid System with Special Reference to the Determination of Surface Area and Porosity. Pure and Applied Chemistry. 57 (4) 603-626 (1985).
- Zhang H, Tang C, Lv Y, Chuanzhi S, Gao F, Dong L, Chen Y, Synthesis, characterization, and catalytic performance of copper-containing SBA-15 in the phenol hydroxylation. Journal of Colloid and Interface Science. 380 (1): 16–24 (2012).
- Park S, Lee S.Y, A study on hydrogen-storage behaviors of nickel-loaded mesoporous MCM-4. Journal of Colloid and Interface Science. 346 (1): 164–198 (2010).
- Tsoncheva T, Issa G, Genova I, Dimitrov M, Formation of catalytic active sites in copper and manganese modified SBA-15 mesoporous silica. Journal of Porous Materials. DOI 10.1007/s10934-013-9722-2, In press (2013).
- Ghattas M.S, Cobalt-modified mesoporous FSM-16 silica: Characterization and catalytic study. Microporous and Mesoporous Materials. 97 (1-3): 107-113 (2006).
- Om Prakash, S. A. Iqbal and G. Jacob., Orient.J. Chem., 29(3), 1079-1084, (2013)
- Neeti Rathore and Bal Krishan., Orient. J. Chem. 29(3), 1001-1008, (2013)
- F.F. Bentley, L.D. Smithson, A.L. Rozek, IR Sperctra and Character. Frequences 700–300 cm–1: A Collection of Spectra, Interpretation, and Bibliography, 1st edn. (Interscience, New York, (1968).
- Innocenzi P, Infrared spectroscopy of sol–gel derived silica-based films: a spectra-microstructure overview. Journal of Non-Crystalline Solids. 316 (2-3): 309-317 (2003).
- Cerruti M, Magnacca G, Bolis V, Morterra C, Characterization of sol–gel bioglasses with the use of simple model systems: a surface-chemistry approach. Journal of Materials Chemistry. 13 1279-1284 (2003).
- Bendjeriou A, Derrien G, Charnay A, Chorro C, Partyka S, Calorimetric investigation of the adsorption of cationic dimeric surfactants with a hydrophilic spacer group onto silica. Thermochimica Acta. 434 (1-2) 171–176 (2005).
- R. Zana, Specialist Surfactants, Chapman & Hall, London, 1997 (Chapter 4).
- Chorro M, Chorro C, Dolladille O, Partyka S, Zana R, Adsorption Mechanism of Conventional and Dimeric Cationic Surfactants on Silica Surface: Effect of the State of the Surface. Journal of Colloid and Interface Science. 210 (1) 134-142 (1999).
- Dreja M, Pyckhout-Hintzen W, Mays H, Tieke B, Cationic Gemini Surfactants with Oligo(oxyethylene) Spacer Groups and Their Use in the Polymerization of Styrene in Ternary Microemulsion. Langmuir. 15 (2) 391–399 (1999).
2CH3S

This work is licensed under a Creative Commons Attribution 4.0 International License.
![]()
A New Edition of Web of Science
Journal Impact Factor
2022: 0.5
Five Year: 0.8
Journal is Indexed in

Cabells Whitelist
![]()


