Growth and Characterization of Urea L-valine a Organic Non Linear Optical Crystal
DOI : http://dx.doi.org/10.13005/ojc/290416
Download this article as:
![]()
Single crystals of new organic nonlinear optical material urea L-valine were grown by slow eveporation solution growth technique at room temperature.Elemental compostion percentages were analysed using CHN study. Crystalline nature of the sample was confirmed by powder XRD. A functional group present in the crystal was identified using FT-IR spectral analysis. An optical transmittance study was also carried out for the crystal. Dielectric studies were performed with respect to temperature at various frequencies (50Hz-5MHz). Photoconductivity study reveals the negative photoconductivity nature of the crystal. Powder second generation efficiency of the crystal was studied using modified kurtz and perry technique.
KEYWORDS:Nonlinear;powder X-ray diffraction;optical;dielectric;photoconductivity;Single crystal XRD
Introduction
The search for new organic nonlinear optical crystals has been of great interest because of their wide range of potential applications such as frequency doubling, optical switching, optical disk data storage, optical modulation, laser remote sensing and medical diagnostics. These materials attracting significant attention as they posses large nonlinear optical susceptibilities, ultrafast nonlinear response time, high laser damage threshold and scope for introducing desirable characteristics by multifunctional substitutions [1-3]. For NLO device applications still there is a demand for good quality crystals with higher efficiency. For the past ten years amino acids are playing a vital role in the nonlinear optical crystal growth. They individually exhibit nonlinear properties as they posses proton donor carboxyl acid (COO–) and proton acceptor amino (NH3) group also in solid state they exist as zwitterions. Amino acid crystals play a major role in NLO applications such as L-valine, L-alanine,L-proline, L-leucine, L-histidine, L-arginine and L-phenylalanine. Worldwide urea and its derivatives are extensively used in crystal engineering and supramolecular chemistry for their flexibility in the synthesis of functional materials. Also for a long time it is used as a model system for crystals from solution growth and reference material in Powder SHG [3-9].
In the present work urea and L-valine single crystals were grown by slow evaporation solution growth technique. The grown crystal was characterized by various characterization techniques such as CHN analysis, powder XRD, FT-IR, optical transmittance, dielectric, photoconductivity and powder SHG measurements.
Materials and methods
Crystal growth
Urea L-valine single crystals were grown by slow evaporation solution growth technique at room temperature. Urea and L-valine were seperately taken in equilmolar ratio and dissolved in double distilled water and stirred seperately for half an hour. Then the solutions were mixed together and stirred well for about 5 hrs. the saturated solution was filtered using whatman (No:42 grade) filter paper. The filtered solution was kept at undisturbed place for crystal growth. After two weeks optically good qulity single crystals were obtained from the mother solution. Fig. 1 shows the quality of the crystal.
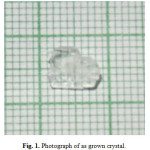 |
Fig. 1. Photograph of as grown crystal. Click here to View figure |
Result and discussion
CHN analysis
The elemental composition percentage of urea L-valine crystals were analysed using Vario EL III Elemental analyser. The experimental C, H and N percentages were compared with theoritical values and listed in Table 1. Which confirms the prescence of the compound.
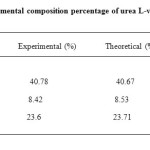 |
Table1. Elemental composition percentage of urea L-valine crystals Click here to View table |
Powder XRD
Powder X-ray diffraction studies for the grown crystals were carried out using RICH SIEFERT X-ray powder diffractometer using CuKα (λ=1.5405 Å) radiation. Sample was scanned over 2θ the range of 5-80 at rate of 3◦/min. The crystals were finely grained into powder in uniformed size and subjected to analysis. Crystalline nature was quite clear from the occurrence of sharp peaks at specific Bragg’s angles. Fig. 2 shows the recorded spectrum. The powder XRD result of this crystal was compared with previous reports in which urea and L-valine were mixed with acids and metals. From the XRD peak intensity it is concluded that in the present work crystalline nature was very high while comparing previous reports [10-15].
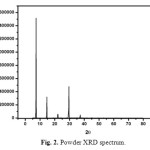 |
Fig. 2. Powder XRD spectrum. Click here to View figure |
FT-IR analysis
The middle IR spectrum of urea L-valine crystal is carried out at room temperature in the spectral range of 4000-400cm-1 by KBr pellet technique. The recorded spectrum is shown in Fig. 3. The band observed at 3344 and 3444 cm-1 are assigned to OH and NH2 symmetric and asymmetric stretching vibrations. The torsional mode of NH3 is observed at 543 cm-1. The peak at 669 cm-1 is due to OH bending vibration. The symmetric and asymmetric stretching vibrations of CH2 are observed at 2881 and 2947 cm-1. Bands observed at 1029 and 1469 cm-1 are assigned to N-C-N symmetric and asymmetric stretching vibration of urea. Frequencies at 1431 and 1327 cm-1 are assigned to C-O stretching vibration of L-valine. The symmetric and asymmetric stretching of COO– vibrations (carboxylate anion) are found at 1585 and 1431 cm-1 respectively. The absorption band at 1068 and 1585 cm-1 are assigned to CN and C=O stretching vibrations respectively. CH2 bending vibration is observed at 1350 cm-1. NH2 in-plane bending vibration appears at 1585 cm-1. The C-C skeletal vibration is observed at 775 cm-1. The peak around 1145 cm-1 is due to NH2 rocking vibration. COO– rocking vibration could be assigned to peaks 543 and 428 cm-1. The frequencies at 713, 821 and 948 cm-1 are correspond to CH out-of-plane bending vibration.
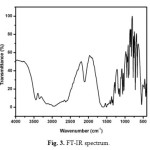 |
Fig. 3. FT-IR spectrum Click here to View figure |
Optical studies
Optical transmittance is one of the important desirable properties for identifying the potential NLO material. Optical transmittance studies were carried out in the wavelength range between 200-1100nm using a Perkin-Elmer lambda 35 spectrometer. Fig. 4 represents the transmittance spectrum of urea L-valine crystal. Crystal exhibits large transmittance in the visible region, possessing a transmittance greater than 80% for incident wavelength ranging from 300 to 1200nm. Lower cut off wavelength of the crystal is 245 nm. Optical band gap (Eg) of the material was evaluated by the extrapolation of the linear part [16, 17]. Which is represented in Fig. 5 from the graph band gap energy is calculated as 3.03eV. Large transmittance and high band gap is one of the important for materials possessing greater possibilities for nonlinear device applications [18-20].
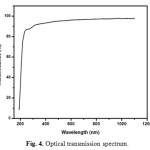 |
Fig. 4. Optical transmission spectrum. Click here to View figure |
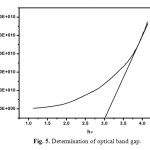 |
Fig. 5. Determination of optical band gap. Click here to View figure |
Dielectric studies
Dielectric studies for the crystals were performed using Hioki 3532-50 LCR meter. Measurements were carried out in the frequency range from 50Hz to 5MHz at various temperature (303 to 378K). Dielectric constant of the crystals were calculated using the capacitance value by the given relation
Where C is the capacitance and d is the thickness of the sample, A is the cross sectional area of the sample and is the free space permitivity of the sample. Fig. 6 shows dielectric constant with respect to log frequency. From the figure it is observed that dielectric constant is very high at low frequency and becomes low at high frequency (Upto 1MHz) and attains minimum value at higher frequencies (Above 1MHz). High dielectric constant at low frequency is due to the prescence of all four polarizations namely electronic, ionic, space charge and orientation. Low value at higher frequency is due to significant loss of these polarizations [21]. Fig. 7 shows the dielectric loss Vs log frequency. The dielectric loss is very low at high frequency it confirms that grown crystal possess less defects with enhanced optical quality. Materials with high dielectric constant and low dielectric loss can be very much useful for capacitor and heating devices applications [22].
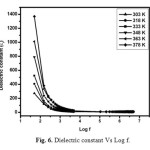 |
Fig. 6. Dielectric constant Vs Log f. Click here to View figure |
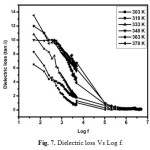 |
Fig. 7. Dielectric loss Vs Log f. Click here to View figure |
Photoconductivity
Photoconductivity studies were carried out at room temperature using Keithley 6512 electrometer. Crystal was silver pasted on opposite faces and thin copper wire was connected both sides on the sample and it is connected in series with electrometer. The sample was protected from all the radiation. The applied input voltage was increased from 10 to 100V and resultant dark current was recorded. Then the samples were exposed to radiation from 100W halogen lamp containing iodine vapour and tungston filament. Phtocurrent was recorded for the same input voltage. Fig. 8 shows the photo current and dark current response for the sample. From the figure it is concluded that dark current is higher than photocurrent and this phenomena is called negative photoconductivity. It may be due to the reduction of charge carriers in the prescence of radiation. Further it was explained by Stockman model [23]. Negative photoconductivity materials can be used for UV and IR detector applications [24].
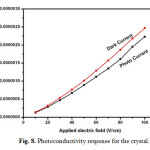 |
Fig. 8. Photoconductivity response for the crystal. Click here to View figure |
Powder SHG
Powder second harmonic generation efficiency of the grown crystal was determined using modified Kurtz and Perry method [25]. Q-switched mode locked Nd:YAG laser was used as a optical source. The crystals were grained into powder and densly packed between two glass slides. The input energy was measured using power meter and it is 4.6mJ/s. Powdered KDP crystal was used as a reference material. The laser light (1064nm) was focussed on to the sample. The green output (532nm) was collected by a photomultiplier tube and finally measured on the storage oscilloscope (CRO) as output voltage. Output signal of 15mV is obtained for the titled compound while the KDP is 7.4mV. It is concluded that title compound is times 2.02 times greater than that of reference KDP.
Single crystal XRD analysis
The unit cell parameters are determined by using the singlecrystal X-ray diffraction data obtained with a four-circle Nonius CAD4/diffractometer ( MoKα, λ = 0.710738 Å). The unit cell parameters are a = 5.771(1) Å, b = 6.012(1) Å, c = 12.295(5) Å, α= 90°β = 90° γ = 90° and volume = 426.8(2) Å3. From the data, it is observed that the grown crystal is belongs to orthorhombic system.
Conclusion
Urea L-valine single crystals were grown by slow evaporation solution growth technique at room temperature. Crystalline nature of the compound was confirmed by powder XRD analysis. A functional group present in the crystal was identified using FT-IR studies. Optical transmision study confirms the quality of the crystals for NLO applications. Optical band was found to be 3.03eV. In dielectrics dielectric constant is very high at low frequency. Phtoconductivity study reveals the negative photoconductivity nature of the crystal. powder SHG efficiency of the grown crystal is 2.02 times greater than KDP.
Acknowledgement
The authors would like to acknowledge Dr P.K. Das,Indian Institute of Science for NLO studies.
Reference
- P. Kumaresan, S. Moorthy Babu, P.M. Anbarasan, Optical Materials 30 (2008) 1361–1368.
- A. Joseph Arul Pragasam, J. Madhavan, , M. Gulam Mohamed, S. Selvakumar, K. Ambujam, P. Sagayaraj, Optical Materials 29 (2006) 173–179.
- G. Madhurambal and P. Anbu Srivinasan, Crystal Research Technology 41 (2006) 231-235.
- S. Pandiarajan, M. Umadevi, R.K. Rajaram, V. Ramakrishnan, Spectrochimica Acta Part A:
- Molecular and Biomolecular Spectroscopy 62 (2005) 630–636.
- Sweta Moitra, Tanusree Kar, Journal of Crystal Growth 310 (2008) 4539–4543.
- G. Bhagavannarayana, B. Riscob, Mohd. Shakir, Materials Chemistry and Physics 126 (2011) 20–23.
- J. Chandrasekaran, P. Ilayabarathi, P. Maadeswaran, Optoelectronics and Advanced Materials – Rapid Communications 5 (2011) 1325 – 1327.
- Hiromu Yoshiura, Hiroshi Nagano, Izumi Hirasawa, Journal of Crystal Growth 363 (2013) 55–60.
- A. Cyrac Peter, M. Vimalan, P. Sagayaraj, J. Madhavan, Physica B 405 (2010) 65–71.
- J. Chandrasekaran, P. Ilayabarathi, P. Maadeswaran, P. Mohamed Kutty, S. Pari, Optik 123 (2012) 1407–1409.
- P. Maadeswaran, J. Chandrasekaran, Optik 122 (2011) 1128–1131.
- A. Puhal Raj, C. Ramachandra Raja, Spectrochimica Acta Part A: Molecular and Biomolecular Spectroscopy 97 (2012) 83–87.
- Bal Krishan, Om Prakash and E.H.El-Mossalamy, Orient.J. Chem., 29(1), 381-388, (2013)
- Om Prakash, S. A. Iqbal, G. Jacob., Orient. J. Chem., 29(3), 1079-1084 (2013).
- V.K. Dixit, S. Vanishri, H.L. Bhat, E. de Matos Gomes, M. Belsley, Santinha, G. Arunmozhi, V. Venkataramanan, F. Proena, A. Criado, Journal of Crystal Growth 253 (2003) 460–466.
- J. Tauc, Amorphous and Liquid semiconductors, J. Tauc Edition, Plenum, New York, 1974.
- J. Chandrasekaran, S. Balaprabhakaran, B. Babu, Optik (2013) Article in press.
- J. Chandrasekarana, B. Babu, S. Balaprabhakaran, P. Ilayabarathi, P.Maadeswaran, K. Sathishkumar, Optik (2012) Article in press.
- S. Dhanuskodi and K. Vasantha, Crystal research Technology 39 (2004) 259-265.
- G. Shanmugam, S. Brahadeeswaran, Spectrochimica Acta Part A: Molecular and Biomolecular Spectroscopy 95 (2012) 177–183.
- V. Chithambaram, S. Jerome Das, S. Krishnan, Journal of Alloys and Compounds 509 (2011) 4543-4546.
- J. Chandrasekaran, S. Balaprabhakaran, B. Babu, Optik (2013) Article in press.
- V.N. Joshi, Photoconductivity, Marcel Dekker, New York, 1990.
- B. Babu, J. Chandrasekaran, S. Balaprabhakaran and P. Ilayabarathi, Material Science- Poland 31 (2013) 151-157.


![]()


