Electrochemical study of Conducting Polymer/Lignin Composites
DOI : http://dx.doi.org/10.13005/ojc/290411
Download this article as:
![]()
Electropolymerization and redox behavior of lignin composites were characterized by cyclic voltammetry (CV), electrochemical quartz crystal microbalance (EQCM), and Fourier transform infrared spectroscopy (FTIR). Oxidation of lignin (LG) composites mixed with different polymers such as; Poly (o-phenylenediamine) (POPDA), Pyrrole (Py), 4-amino-3-hydroxynaphthalene-sulfonic acid (AHNSA) on working glassy carbon electrode (GCE) were performed by cyclic voltammetry in a three-electrode electrochemical cell. EQCM was used during polymerization technique and detecting the continuous mass increase with the number of potential cycles. Transmission FTIR spectra of the electropolymerized film of pyrrole and lignin composite polymer after deposition were recorded. These results gave evidence of lignin composite formation due to the fact that new and broad bands in the region of 3411−3460 cm−1 were observed.
KEYWORDS:Lignin, Poly (o-phenylenediamine), Pyrrole, 4-amino-3-hydroxynaphthalene-sulfonic acid, Composite electrode; Electrosynthesis; Cyclic voltammetry; Electrochemical quartz crystal microbalance; Fourier transform infrared spectroscopy.
INTRODUCTION
Conducting polymers are polymeric materials that have both metallic and semiconductor characteristics. A key property of a conductive polymer is the presence of conjugated double bonds along the backbone of the polymer. Conducting polymers (CPs) have been attracting attention of material scientists and electrochemists for many years because of their simple preparation, high electroconductivity, as well as good-looking electrochemical and optical properties. [1]. Lignin is a polymeric component naturally found in the cell walls of higher order plants. It forms a highly efficient composite system with cellulose and hemicelluloses (carbohydrate polymers).
Lignin’s role in this composite is to act as a matrix material that binds the plant polysaccharide and fibers, there by imparting the strength and rigidity to the plant stem necessary for vertical growth [2]. Lignin molecules are derived mainly from three phenylpropane monomers: p-coumaryl alcohol, coniferyl alcohol, and synapyl alcohol (Fig.1). Monolignols are polymerized by a radical coupling process that links them by carbon-carbon or ether bonds [3- 6]. After synthesis of conducting polymers characterization of the material is an important step because it gives useful parameters in determining the electrochemical properties of the polymer. Physico-chemical methods involve the application of electroanalytical techniques like cyclic voltammetry [7, 9] and electrochemical quartz crystal microbalance [10-11]. Such types of techniques are useful to give and determine the redox behavior of conducting polymers.
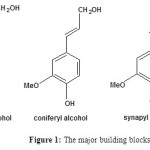 |
Figure 1: The major building blocks of lignin. Click here to View Figure |
Studies on the electrochemical modification of lignin started in the middle of the 1940s [12]. Papers are dedicated to the lignin oxidation on different electrodes for the sake of the development of a voltammetric lignin analysis method such as adsorption on polycrystalline gold electrodes [13], Lignosulfonate modified glassy carbon electrode [14], polypyrrole/lignin composite [15-16], chloroaniline/lignin [17] have been discussed.
This paper reports the successful preparation of composites modified electrode on glassy carbon electrode surface (LG/GCE, AHNSA/GCE, POPDA/GCE, and its composite (LG-co-AHNSA and LG-co-OPDA) by repetitive CV scans, to improve the electrochemical behavior of the prepared modified electrode by Cyclic voltammetry, Electrochemical Quartz Crystal Microbalance (EQCM) techniques and characterize with Fourier transform infrared spectroscopy (FTIR). The influence of several parameters e.g. peak current, scan rate and peak potential will be examined.
EXPERIMENTAL
All chemical and reagents used were analytical grade (Aldrich). The supporting electrolyte used for electrochemical method were 0.1 M HNO3 and H2SO4 (0.5 & 1.0 M) solutions. Lignin, o-phenylenediamine, pyrrole, and 4-amino-3-hydroxynaphthalene-sulfonic acid monomers were used to prepare the monomer solution. Phosphate buffer solution was prepared from 0.1 M KH2PO4 and K2HPO4 by using distilled water. Distilled water (DW) was used to prepare all solution. Cyclic voltammetric (CV) experiments were performed with (BASI-Epsilon) voltammetric analyzer and carried out with three-electrode conventional system, including a platinum wire as counter electrode, Ag/AgCl/Cl– as reference electrode, and a bare (3 mm diameter) is film coated glassy carbon electrode was used as working electrode. Infrared (IR) spectra were recorded using a Perkin Elmer FT-IR BX spectrophotometer in the range 4000-400 cm-1 with samples prepared using KBr pellets. In EQCM measurements, AUTOLAB (model AUT 84141) POTENTIOSTAT/GALVANOSTAT, electrochemical analyzer was used in a three-electrode electrochemical cell arrangement.
RESULTS AND DISCUSSIONS
Electrochemical characterization of LG/GCE
The electrochemical behavior of lignin and its film composite modified electrode on glassy carbon were studied by using cyclic voltammetry in 0.1 M nitric acid as a supporting electrolyte. As shown in Fig.2 (A), CVs of the lignin modified electrode show reversible redox couples (quinone/hydroquinone) in the potential between 0.35 V to 0.55 V which in agreement with literature results [14-15].Both anodic and cathodic peak potentials are also independent of the scan rates. Fig.6 (B) shows that the anodic and cathodic peak currents are linearly dependent on the potential scan rates, with regression coefficients (r2) of 0.9998 and 0.9999, respectively. This shows the electrode reaction is mainly an adsorption controlled process.
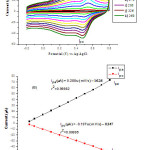 |
Figure 2: Cyclic voltammograms of LG/GC electrode recorded at scan rates of 10 – 250 mV/s (inner to outer) in 0.1 M HNO3 (A), plot of peak currents vs. scan rates (B). Click here to View table |
Electrochemical characterization of AHNSA/GCE
Fig.3 (A) shows the cyclic voltammograms obtained at poly AHNSA modified GCE in 0.1 M HNO3by cycling the potential between – 0.20 and 0.80 V in the potential scan rate of 10 – 250 mV/s. The voltammograms show three reversible redox couples at potentials (Eap/Ecp) of 0.071/0.038, 0.206/0.161, and 0.364/0.28 V respectively, due to electroactive deposition of the polymer film at the electrode surface. As shown in Fig.3 (B) both the anodic and cathodic peak currents increases linearly with increasing scan rate, with a regression coefficient of r2 = 0.99951/0.99984, r2 = 0.99405/0.99963, and r2 = 0.97519/0.98999 for Ipa/Ipc, IIpa/IIpc, and IIIpa/IIIpc respectively. From Fig.3 (C) not shown; the plot of peak current versus square root of scan rate gives a straight line with lower correlation coefficient which suggests the electrode process is mainly an adsorption controlled. From the three consecutive reversible redox couple peak currents (Ipa/Ipc) formed at a potential of 0.071/0.038 V has higher in current response values than the other two couples, due to a better film growth and fast electron transfer occurrence at this potential.
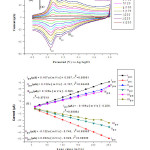 |
Figure 3:Cyclic voltammograms of AHNSA/GC electrode recorded at scan rates of 10 – 250 mV/s (inner to outer) in 0.1 M HNO3 (A),plot of peak currents against scan rates (B), and plot of peak currents vs. square root of scan rate (C). Click here to View Figure |
Electrochemical characterization of LG-co-AHNSA/GCE
The composite film obtained by electropolymerization process (synthesized at +0.9 V) was characterized by cyclic voltammetry at scan rates between 10 and 250 mV/s in a monomer free 0.1M HNO3. The corresponding cyclic voltammogram (CVs) presented in Fig.4 (A) shows a linear dependence of the peak current with scan rate, which is a characteristic of surface-bound composite film electroactive species undergoing fast electron transfer reaction at the electrode. It is interesting to note that the composite peak exhibits a relatively broad in the reverse scan (IIpc) but reversible redox process which illustrates its electroactivity. As can be seen in Fig.4 (B), both the anodic and cathodic currents of the composite polymer show a linear dependence with the scan rate, having an anodic (Ipa,IIpa) up to 225 mV/s and cathodic (Ipc,IIpc) regression coefficient of r2 = 0.98442, 0.94878, and r2 = 0.99954,0.99979 , respectively.
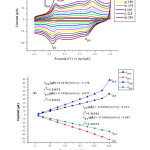 |
Figure 4: Cyclic voltammograms of LG-co-AHNSA/GCE composite film modified electrode recorded at scan rates of 10 – 250 mV/s (inner to outer) in 0.1 M HNO3 (A), plots of peak current vs. scan rate and their square roots for (B) and (C), respectively. Click here to View Figure |
Fig.5 (A) shows cyclic voltammograms obtained at composites modified (c); AHNSA modified (a) and LG (b) electrodes under similar conditions. The result shows a better peak current response at the composites modified electrode than the pure polymer modified one. This shows that the composites modified electrode is a good electron transfer medium.
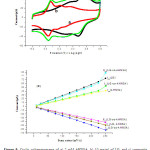 |
Figure 5: Cyclic voltammograms of a) 2 mM AHNSA, b) 10 mg/ml of LG, and c) composite films, scan rate 200 mV/s (A) their peak current dependence at a scan rates of 10 – 250 mV/s in 0.1 M HNO3 supporting electrolyte solution (B). Click here to View Figure |
Electrochemical characterization of POPDA/GCE
The dependence of the cyclic voltammograms of the POPDA polymer (0.05 M) in 0.1 M HNO3 upon a sweep potential between -0.2 and 0.8 V and in the range of scan rates (10-250 mV/s) is shown in Fig.6 (A). Both peak current results are linearly dependent with the respective scan rates from Fig.6 (B) in the range studied, the resulted graph showed excellent linearity with correlation co-efficient shown on the graph below. This result indicating that the electrodeprocess of POPDA is diffusion controlled, in agreement with the literature [16].
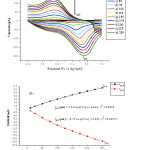 |
Figure 6: Cyclic voltammograms of POPDA|GC modified electrode recorded at scan rates of 10 – 250 mV/s (inner to outer) in 0.1 M HNO3 (A), plot of peak currents on scan rates (B). Click here to View Figure |
Electrochemical characterization of LG-co-POPDA/GCE
The electroactive composite modified electrode was monitored in the monomer free supporting electrolyte system as a function of scan rate during cyclic voltammetry in Fig. 7 (A). The voltammogram show two redox couples (Ipa/Ipc and IIpc/IIpc) at potentials of -0.027/-0.209 V and 0.559/0.179 V respectively, there by confirming the formation of the composites. The related anodic and cathodic peak current responses as a function of scan rates were shown in fig.7 (B) below. As can be seen, both peak currents of the composites show a linear dependence with the scan rate, having an anodic (Ipa,IIpa) and cathodic (Ipc,IIpc) correlation coefficient or regression fit of r2 = 0.99918, 0.99997 andr2= 0.99906, 0.99822, respectively. This result shows the electrode process to be an adsorption dependent.
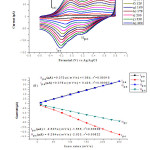 |
Figure 7:Cyclic voltammograms of LG-co-OPDA|GC composite film modified electrode recorded at scan rates of 10 – 250 mV/s (inner to outer) in 0.1 M HNO3 (A), graphs of peak currents on its scan rates (B). Click here to View Figure |
Comparison between two composite films of LG-co-AHNSA/GCE and LG-co-POPDA/GCE, show lignin composite with o-phenyelenediamine (LG-co-POPDA/GCE) had a major peak current value in both anodic and cathodic responses (Fig. 8).
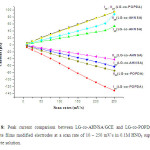 |
Figure 8: Peak current comparison between LG-co-AHNSA/GCE and LG-co-POPDA/GCE composite films modified electrodes at a scan rate of 10 – 250 mV/s in 0.1M HNO3 supporting electrolyte solution. Click here to View Figure |
Determination of surface coverage (Γ)
The value of peak current of lignin and its composites modified electrode is closely related to the maximum surface coverage, which is adsorbed on the working electrode surface. From the slope of the linear plot of peak current versus scan rates, it has been observed that the presence of composite polymers increases the overall back ground current. These results are clear with the active surface coverage (the surface concentration of the electroactive species), charge accumulations, and the charge storing capacity values of the modified electrodes were given in
Table 1. Results given below have higher values than lignin modified gold electrode [12]. The maximum average surface coverage and charge were calculated in 9.22 x 10⁻¹⁰ mol cm-2, 24.91µC; 8.99 x 10⁻¹⁰ mol cm-2, 24.29 µC; and 17.215 x 10⁻¹⁰ mol cm-2, 46.51µC for LG/GCE, LG-co-AHNSA/GCE, and LG-co-POPDA/GCE, respectively; according to the following equation [17].
Γ = Q/nFA (1)
Ip = n2F2AΓν/4RT (2)
Ip = Cν (3)
Where Q is the charge consumed under cyclic voltammetry (coulomb), C is charge storing capacitance (farad), n denotes the number of electrons transferred in the redox process, F is faraday constant (96485 coulomb/mol), A is electrode area (cm2), Γ is surface attached material concentration (mol cm-2),ν is scan rate (V/s), R is universal gas constant (8.3145 J/mol K), and T is temperature (K).
The overall surface coverage and the charge Q associated with the reduction or oxidation of the adsorbed layer of lignin modified electrodes increasing by building composites. From the table below there is a higher value of surface coverage, charge and capacitance occurrence in POPDA than its composite but there is a better shift in potential peaks (lowering) in composite films. Those have been done from the cyclic voltammograms. Thus shift in potential and higher peak current parameters gives best sensitivity in lignin composites modified electrodes.
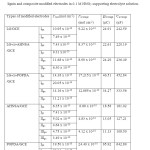 |
Table 1: Comparison of surface coverage concentration (Γ), charge, and capacitance between lignin and composite modified electrodes in 0.1 M HNO3 supporting electrolyte solution. Click here to View table |
Average peak current (Ip) =(Anodic+cathodic)/2
Electrochemical Quartz Crystal Microbalance (EQCM)
Fig.9 (A) shows the electrochemical polymerization of pyrrole, in each subsequent cycle the intensity of peak current increases due to the deposition of electroactive species on the surface of an electrode. This deposition indicates that polypyrrole can be synthesized electrochemically. The polymer/lignin composite was also synthesized and a better response (current intensity and lower potential shift) character than that of pure polypyrrole were obtained (Fig.9 B).This is due to the presence and electroactive species contribution of lignin.
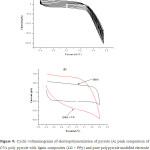 |
Figure 9: Cyclic voltammograms of electropolymerization of pyrrole (A) peak comparison of CVs poly pyrrole with lignin composites (LG + PPy) and pure polypyrrole modified electrode (B) in the potential range from -0.4 to +0.3 V: 1.0 M H2SO4 as supporting electrolyte Click here to View Figure |
The potentiodynamic deposition and dissolution of 1.0 M AgNO3 is shown in Fig.10. Curve ‘’a’’ is the dissolution and deposition signal of Ag in the forward and reverse potential scan respectively, while curve ‘’b’’ shows the frequency dependence. From the frequency change vs. potential (Δf-E) curve, we can deduce quantitatively the change in mass of the deposited analyte. The crystal quartz microbalance calibration is based on the verification of the Sauerbrey law that relates the frequency variation of crystal quartz with its mass variation. The simplified Sauerbrey equation for a uniform, thin film can be written as:
∆f = -2.26×10⁻⁶f2∆m
Where, ∆f is the measure of frequency change and f is its fundamental (resonant) frequency, both measured in Hz, ∆m is the mass variation. The calibration was based on the potentiodynamic deposition and dissolution of 1 mM of silver nitrate in 1.0 M sulfuric acid solution. The charge consumed was found from current vs. potential curve as 1.322×10⁻⁴ C while the corresponding mass change was found to be 1.478×10⁻⁷ g. These data were inserted in the Sauerbrey equation in the form:
MAg =∆mF/∆Q
giving the atomic mass for silver as 107.8 g/mol, this is in excellent agreement with the actual value.
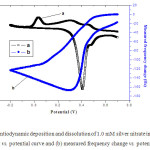 |
Figure 10 : Potentiodynamic deposition and dissolution of 1.0 mM silver nitrate in 1.0 M sulfuric acid, (a) current vs. potential curve and (b) measured frequency change vs. potential curve. Click here to View Figure |
Fig.11(A) and (B) shows cyclic voltammograms (CVs) and their corresponding frequency shifts at the same time as recorded during consecutive potential cycles in a 1.0 M H2SO4 solution containing pyrrole and lignin plus pyrrole, respectively in a potential range between -0.40 and 0.6 V in both polymerizations. Steady PPy and PPy + LG growth were observed from the decrease in frequency with the increasing number of cycles. Deposition of the oxidized pyrrole and composite were started from the very first cyclic voltammetric peak current during the first potential cycle from the two figures shown below.
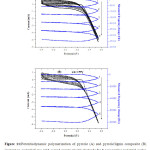 |
Figure 11:Potentiodynamic polymerization of pyrrole (A) and pyrrole/lignin composite (B) (current vs. potential) at a gold-coated quartz crystal electrode for 5 consecutive potential cycles and the Frequency shifts recorded in 1.0 M sulfuric acid. Click here to View table |
Fig.12 (A) shows the variation of charge up on each cycle and (B) plots of resonant frequency change of the quartz resonators during the electrochemical synthesis of the PPy and PPy/LG composite. The almost linear negative resonant frequency shift (Δf) versus charge passed (ΔQ) during the polymerization indicate linear and homogeneous film growths on the gold EQCM under the given experimental conditions [18]. The slope (Δf/ΔQ) is almost twice for the poly-pyrrole/lignin composites indicating the incorporation of lignin during the electrosynthesis.
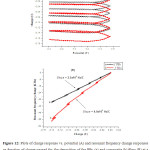 |
Figure 12: Plots of charge response vs. potential (A) and resonant frequency change responses as function of charge passed for the deposition of the PPy (a) and composite (b) films (B) at a gold-coated quartz crystal electrode for 5 consecutive potential cycles in 1.0 M sulfuric acid. Click here to View Figure |
As shown in the Fig.13 below, after the polymerization, the total change in frequency is higher in the composite material indicating the deposition of higher amount of material or the deposition of significant amount of lignin along with the poly-pyrrole (PPy). It can also be seen from the above figure that the total change in mass or frequency increases with every cycle which indicates that the amount of film material deposited on the electrode increases with each cycle. The rate is higher in the case of the composite as shown from the higher slope in the inset figure.
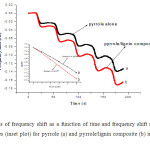 |
Figure 13: Plots of frequency shift as a function of time and frequency shift as a function of number of cycles (inset plot)for pyrrole (a) and pyrrole/lignin composite (b) in 1.0 M sulfuric acid. Click here to View Figure |
Characterization of the electrosynthesized film by FTIR
IR spectra of the polypyrrole and polypyrrole/lignin composite polymerized material made in H2SO4 are compared in Fig.14.The most characteristic bands of the polypyrrole are (3500–3200 cm−1) specifically present in the spectra around 3211 cm-1 intense and sharp peak due to the stretching vibration of N-H bond [19] while in the spectra assigned by letter ‘’a’’ there is a broad band peak formation in the region between (3411−3460 cm−1) [20] due to peaks corresponding to OH stretching of lignin contribution that is shown in the inset spectra below.
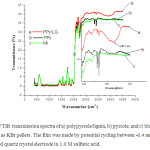 |
Figure 14: FTIR transmission spectra of a) polypyrrole/lignin, b) pyrrole, and c) blank (absence of polymer) as KBr pellets. The film was made by potential cycling between -0.4 and +0.6 V on a gold-coated quartz crystal electrode in 1.0 M sulfuric acid. Click here to View Figure |
CONCLUSION
The presents work demonstrates that consecutive CVs, LG-co-POPDA/GCE composite modified electrode were successfully synthesized directly by deposition of POPDA and then LG on the electrode surface. The nature of supporting electrolyte (cations and anions) in the redox response process has an important effect on the redox reaction and consequently on the current peak. When lignin and its composite modified glassy carbon electrode up on oxidation, it undergoes the formation of electroactive quinone functionalities capable of undergoing reversible two proton-coupled (2e–/2H+) oxidation/reduction cycling. From the electrochemical results it can be concluded that a reproducible and stable electroactive species films can be synthesized in the HNO3 and H2SO4.The redox couple behavior of the film is a characteristic for an adsorptive species that are electrochemically deposited. The spectroscopic results confirm the formation of composites. The absence of some characteristic bands and appearance of new bands in the region of 3411−3460 cm−1 where stretching vibrations are seen gives evidence that coupling (incorporation) between monomer units have been taken place. Stability of the composite modified electrode can be studied by using repeating scan method, the composite films show good stability compared to the pure one.
ACKNOWLEDGMENT
I would like to express my deepest gratitude to Dr. Shimelis Admassie, my worthy advisor, who has been an inspiration during the course of thesis. I would like to thank the Department of Chemistry, Addis Ababa University for providing different chemicals and apparatus required in the study. Finally, my appreciation is also extended to the Ministry of Education for giving me the opportunity to join the post graduate program and for their sponsorship of my study.
References
- C. K. Chiang, C. R. Fincher, Y. W. Park, A. J. Heeger, H. Shirakawa, E. J. Louis, S. C. Gau,A. G. MacDiarmid, Phys. Rev. Lett., 39, 1098 (1977)
- D. Feldman, Chemical, Modification, Properties, and Usage of Lignin, T. Q. Hu, ed.,Kluwer Academic/Plenum Publishers, New York, (2002).
- C. W. Dence, S. Y. Lin, Methods in Lignin Chemistry, S. Y. Lin, C. W. Dence, ed.Springer-Verlag, Berlin, (1992).
- E. Sjöström, Wood Chemistry Fundamentals and Applications, 2nd ed., San Diego, CA: Academic Press, Inc., (1993).
- R. W. Whetten, J. J. MacKay, R. R. Sederoff, Annu. Rev. Plant Physiol. Plant. Mol. Biol., 49585, (1998)
- J. H. Lora, Chemical, Modification, Properties, and Usage of Lignin, T. Q. Hu, ed.,Kluwer Academic/Plenum Publishers, New York, (2002).
- K. Doblhofer, K. Rajeshwar, In Handbook of Conducting Polymers, 3rd ed., T.A.Skotheim, R. L. Elsenbaumer, J. R. Reynolds, ed., Marcel Dekker, New York, (1998).
- S. N. B Jabar and M. Z. Ibrahim., Orient. J. Chem., 28(3), 1117-1121 (2012)
- H. D. Abruna, Coord. Chem. Rev., 86, (1988), 135.
- I. Bunget, M. Popescu,Physics of Solid Dielectrics, Elsevier Publishing Company, Oxford, (1984).
- D. A. Buttry, Applications of the Quartz Crystal Microbalance to Electrochemistry, from Electroanalytical Chemistry: A Series of Advances Vol. 17, edited by Alan J. Bard.
- E. I. Kovalenko, O. V. Popova, A. A. Aleksandrov, T. G. Galikyan, Russ. J. Electrochem., 36, 706, (2000)
- G. Milczarek, Electroanalysis, 19, 1411, (2007).
- G. Milczarek, Electroanalysis, 20, 211, (2008).
- Md. Sadeghi and M. Yarahmadi., Orient. J. Chem., 27(2), 491-498, (2011).
- G. Milczarek, O. Inganäs, Science, 335, 1468, (2012)
- B. M. Lange, N. Hertkorn, H. Sandermann, J. Environ. Sci. Technol., 32, 2113, (1998)
- Y. F. DU, X. M. QI, P. ZHAO, J. X. LU, M. Y. HE, Chin. Chem. Lett., 15, 1098, (2004)
- Y. Li, Surface Electrochemistry: Adsorption of Polyoxometalate on Graphite Electrodes: Experiment #4, Department of Chemistry & Biochemistry University of California, Santa Cruz.
- V. Syritski, A. Öpik, O. Forseń, Electrochimica Acta., 18, 1409, (2003)
- M. G. Walter , C. C. Wamser,J. Phys. Chem., 114, 7563, (2010)
- M. N. M. Ibrahim, N. N. M. Yusof, A. Hashim, Malay. J. Anal. Sci., 11, 206, (2007)


ISSN Online: 2231-5039

![]()


