Development and Validation of a Stability Indicating Liquid Chromatographic Method for Simultaneous Estimation of Dutasteride and Tamsulosin in Combined Dosage Form
DOI : http://dx.doi.org/10.13005/ojc/290456
Download this article as:
![]()
A novel stability indicating isocratic, reversed phase-liquid chromatographic method has been developed and validated for simultaneous quantitative determination of Dutasteride (DTS) and Tamsulosin (TAM) in combined pharmaceutical dosage form. An ACE C18 (250*4.6*5µ) column with mobile phase containing pH 5.2 (Potassiumdihydrogenphosphate) Buffer: Methanol in the ratio of 600:400 (v/v) was used. The flow rate was 1.0 mL/min, column temperature was 30°C and effluents were monitored by using a photodiode array detector at 247 nm. The retention times of Dutasteride and Tamsulosin were found to be 2.419 min and 5.119 min, respectively. Correlation co-efficient for Dutasteride and Tamsulosin were found to be 0.99 and 0.99, respectively. The proposed method was validated with respect to linearity, accuracy, precision, specificity, and robustness. Recovery of Dutasteride and Tamsulosin in formulations was found to be in a range of 97-103% and 97-103% respectively and this confirms the non-interferences of the excipients in the formulation. Dutasteride and Tamsulosin were exposed to stress conditions like acidic hydrolysis, basic hydrolysis, oxidative, photolytic, humidity and thermal conditions. Due to its simplicity, rapidness and high precision, this method was successfully applied to the estimation of Dutasteride and Tamsulosin in combined dosage form.
KEYWORDS:Dutasteride;Tamsulosin;Liquid chromatography;Method validation
INTRODUCTION
Dutasteride (DTS) is chemically (5α,17β)-N-{2,5-bis(trifluoromethyl)phenyl}-3-oxo-4-azaandrost-1-ene-17-carboxamide with an empirical formula C27H30F6N2O2 and molecular weight of 528.5 g/mol. It is a selective inhibitor of both type 1 and type 2 isoforms of 5α-reductase enzyme that converts testosterone to 5α-dihydrotestosterone which is responsible for enlargement of prostate. Dutasteride is used in treatment of benign prostatic hyperplasia, frequently occurring in men over the age of 50 years. Tamsulosin hydrochloride (TAM) is chemically 5-[(2R)-2-[2-(2-ethoxy phenoxy)ethylamino]propyl]-2-methoxy benzenesulfonamide with an empirical formula C20H28N2O5S. It is a selective antagonist of alpha-1A and alpha-1B adrenoreceptors at the prostate. It works by
blocking–receptor that is found in the muscle of the prostate gland, which causes the muscle in the prostate to relax. Tamsulosin is given by mouth as hydrochloride salt. Dutasteride and Tamsulosin hydrochloride Capsules (JALYN) contains the following: One dutasteride oblong, opaque, dull-yellow soft gelatin capsule, containing 0.5 mg of dutasteride dissolved in a mixture of butylated hydroxytoluene and mono-di-glycerides of caprylic/caproic acid. The inactive ingredients in the soft-gelatin capsule shell are ferric oxide (yellow), gelatin, glycerin, and titanium dioxide. Tamsulosin hydrochloride white to off-white pellets, containing 0.4 mg tamsulosin hydrochloride and the inactive ingredients: methacrylic acid copolymer dispersion, microcrystalline cellulose, talc, and triethyl citrate.
EXPERIMENTAL (Materials and Methods)
Instrumentation:
The separation was carried out on Waters 2695 alliance HPLC system with binary HPLC pump, Waters 2998 PDA detector, Waters Empower2 software and an ACE C18 (250*4.6*5µ) column.
Chemicals and Reagents:
Dutasteride and Tamsulosin was a gift sample by Dr. Reddy’s Laboratories Ltd., Hyderabad. Methanol of HPLC grade was purchased from E. Merck (India) Ltd., Mumbai Potassium dihydrogen phosphate of AR grade was obtained from S.D. Fine Chemicals Ltd., Mumbai and milli Q water.
HPLC Conditions:
The mobile phase consisting of water (pH 5.2 adjusted with Potassium dihydrogen phosphate) and methanol (HPLC grade) were filtered through 0.45µ membrane filter before use, degassed and were pumped from the solvent reservoir in the ratio of 600:400 v/v was pumped into the column at a flow rate of 1.0 ml/min. The column temperature was 30°C. The detection was monitored at 247nm and the run time was 8 minutes. The volume of injection loop was 10 µl prior to injection of the drug solution the column was equilibrated for at least 15 min. with the mobile phase flowing through the system.
Preparation of standard solution:
Dutasteride: Accurately weighed quantity, 5.0 mg of Dutasteride was transferred into 25 ml of volumetric flask and adds 10 ml of mobile phase and sonicate for 15 minutes make up the volume with mobile phase. 5 ml of above solution was into 10 ml volumetric flask and diluted to the mark with mobile phase.
Tamsulosin: Accurately weighed quantity, 4.0 mg of Tamsulosin was transferred into 25 ml of volumetric flask and adds 10 ml of mobile phase and sonicate for 15 minutes make up the volume with mobile phase. 5 ml of above solution was transferred into 10 ml volumetric flask and diluted to the mark with mobile phase.
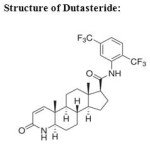 |
Structure of Dutasteride: Click here to View figure |
Preparation of sample (drugs from marketed formulations) solution:
Accurately weighed quantities, 2874 mg of sample powder was transferred into 25 ml of volumetric flask and added 10 ml of mobile phase and sonicate for 30 minutes and make up the volume with mobile phase, filtered through the 0.45 µm filter paper. 5 ml of above solution was transferred into 10 ml volumetric flask and make up the volume with mobile phase.
Statistics:
Results are presented as the mean±SD and results were analyzed using Excel® 10, WinStat®v2003.1 and Chromeleon®. A p value < 0.05 was considered as significant.
RESULTS AND DISCUSSION
The analytical procedure for the estimation of Dutasteride and Tamsulosin in marketed formulation was optimized with a view to develop a precise and accurate assay method. Various mobile phase systems were prepared and used to provide an appropriate chromatographic separation, but the proposed mobile phase containing pH 5.2 (Potassium dihydrogen phosphate) Buffer: Methanol
 |
Structure of Tamsulosin: Click here to View figure |
in the ratio of 600:400 (v/v) gave a better resolution. Using UV-visible PDA detector at 247nm carried out the detection. Amongst the several flow rates tested, the flow rate of 1 ml/min was the best for all the drugs with respect to location and resolution of peaks. The retention time of Dutasteride and Tamsulosin was found to be 2.419 min and 5.119 min respectively. The chromatograms of standard and sample solution of Dutasteride and Tamsulosin were shown in figure 01 and 02 .The asymmetry factor of Dutasteride and Tamsulosin was 1.026 and 1.273 found to be respectively, which indicates symmetrical nature of the peak
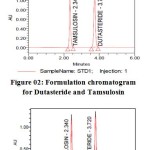 |
Figure 01: Standard chromatogram for Dutasteride and TamsulosinFigure 02: Formulation chromatogram for Dutasteride and Tamsulosin Click here to View figure |
METHOD VALIDATION:
System Suitability Studies:
The column efficiency, resolution and peak asymmetry were calculated for the standard solutions (Table 01). The values obtained demonstrated the suitability of the system for the analysis of this drug combinations, system suitability parameters may fall within ± 3 % standard deviation range during routine performance of the method.
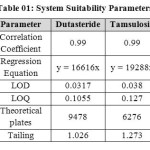 |
Table 01: System Suitability Parameters Click here to View table |
Specificity:
Specificity is the ability to assess unequivocally the analyte in the presence of components which may be expected to be present. Typically these might include impurities, degradants, matrix, etc
Accuracy and Precision:
The accuracy of the method was determined by recovery experiments. The recovery studies were carried out six times and the percentage recovery and standard deviation of the percentage recovery were calculated. From the data obtained, added recoveries of standard drugs were found to be accurate (Table 03&04). The precision of the method was demonstrated by inter-day and intra-day variation studies. In the intraday studies, six repeated injections of standard and sample solutions were made and the response factor of drug peaks and percentage RSD were calculated. In the inter-day variation studies, six repeated injections of standard and sample solutions were made for three consecutive days and response factor of drugs peaks and percentage RSD were calculated. Chromatograms of three different levels are shown in Fig 3, 4 & 5. From the data obtained, the developed RP-HPLC method was found to be precise (Table-02).
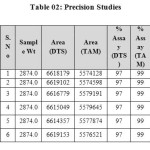 |
Table 02: Precision Studies Click here to View table |
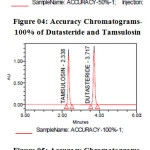 |
Figure 03: Accuracy Chromatograms-50% of Dutasteride and Tamsulosin Figure 04: Accuracy Chromatograms-100% of Dutasteride and Tamsulosin Figure 05: Accuracy Chromatograms-150% of Dutasteride and Tamsulosin Click here to View figure |
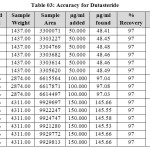 |
Table 03: Accuracy for Dutasteride Click here to View table |
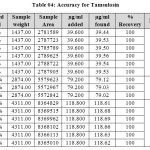 |
Table 04: Accuracy for Tamsulosin Click here to View table |
Linearity and Range:
The linearity of the method was determined at five concentration levels. The calibration curve was constructed by plotting response factor against concentration of drugs. The slope and intercept value for calibration curve was y = 16616 x (R2=0.99) for Tamsulosin and y = 19288 x (R2=0.99) for Dutasteride. The results shows that an excellent correlation exists between areas and concentration of drugs within the concentration range indicated above. The overlay chromatograms of Linearity for Dutasteride and Tamsulosin shown in Fig 6 and the results for calibration curves are given in Figure 07 & 08.
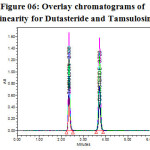 |
Figure 06: Overlay chromatograms of Linearity for Dutasteride and Tamsulosin Click here to View figure |
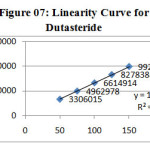 |
Figure 07: Linearity Curve for Dutasteride Click here to View figure |
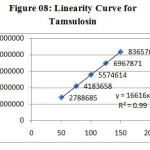 |
Figure 08: Linearity Curve for Tamsulosin Click here to View figure |
Limit of detection & Limit of quantification (LOD & LOQ):
Limit of quantification and detection were predicted by plotting linearity curve for different nominal concentrations of Dutasteride and Tamsulosin. Relative standard deviation (σ) method was applied, the LOQ and LOD values were predicted using following formulas (a) and (b). Precision was established at these predicted levels and the results are tabulated in Table 05.
(a) LOQ = 10 σ / S
(b) LOD = 3.3 σ / S
Where σ = residual standard deviation of response
S = slope of the calibration curve.
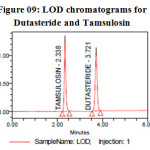 |
Figure 09: LOD chromatograms for Dutasteride and Tamsulosin Click here to View figure |
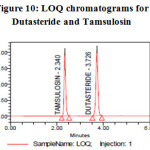 |
Figure 10: LOQ chromatograms for Dutasteride and Tamsulosin Click here to View figure |
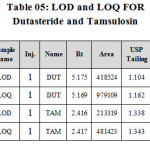 |
Table 05: LOD and LOQ FOR Dutasteride and Tamsulosin Click here to View table |
Robustness:
Robustness of the method was determined by making slight changes in the chromatographic conditions. It was observed that there were no marked changes in the chromatograms, which demonstrated that the RP HPLC method developed, are rugged and robust (Table 07 & 08).
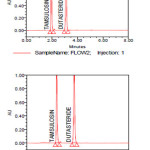 |
Figure 11: Robustness chromatograms for Dutasteride and Tamsulosin Click here to View figure |
FORCED DEGRADATION STUDIES:
The stability studies were determined by applying the physical stress (acid, base, peroxide, heat and light) to the product. It was observed that there were marked degradation in the chromatograms, and the data given in table 09 & 10).
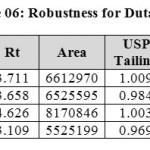 |
Table 06: Robustness for Dutasteride Click here to View table |
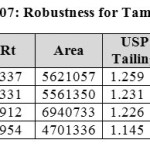 |
Table 07: Robustness for Tamsulosin Click here to View table |
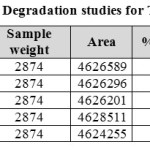 |
Table 08: Degradation studies for Tamsulosin Click here to View table |
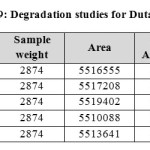 |
Table 9: Degradation studies for Dutasteride Click here to View table |
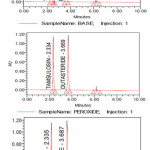 |
Figure 12: chromatograms of forced degradation studies on Dutasteride and Tamsulosin Click here to View figure |
System suitability results were given in table-1 and system suitability parameters are retention time, resolution, tailing and plate count were shown uniformity and %RSD was less than 1, so we can say system is suitable for analysis and method specificity was concluded by fig:1 and fig:2 Dutasteride and Tamsulosin standard chromatogram and other one is formulation they were not observed in placebo and excipients peaks interference with standard and analytic peak so it proves method is selective. The result given in table 03 says that the method precision passed for both Dutasteride and Tamsulosin studies. The method accuracy was evaluated by recovery studies. Dutasteride and Tamsulosin recovery was found to be 97% and 100% as per ICH 97%- 103% and also percentage RSD was very low so method is accurate as shown in table 3 & 4. Linearity calibration curve was given in fig: 7 & 8 and plot the graph three different concentrations versus areas to construct the linear regression equation and to calculate the value of correlation coefficient. Linear correlation was found to be Y= 16616 for Tamsulosin and y = 19288 for Dutasteride Method robustness results were given by table 06&07, LOQ and LOD
Results were given by table 05. Degradation studies are given in table 08 & 09.
CONCLUSION
The proposed HPLC method was found to be simple, precise, accurate and sensitive for the simultaneous estimation of Dutasteride and Tamsulosin in pharmaceutical dosage forms. Hence, this method can easily and conveniently adopt for routine quality control analysis of Dutasteride and Tamsulosin in pure and its pharmaceutical dosage forms.
ACKNOWLEDGEMENT
Authors are thankful to Department of Pharmaceutical Sciences, Jawaharlal Nehru Technological University, Hyderabad and Rainbow Pharma training lab, Kukatpally, for providing instruments and analytical support.
REFERENCES
- Sethi PD, High Performance Liquid Chromatography-Quantitative analysis of Pharmaceutical Formulations, 1st Ed., CBS Publishers & Distributors, New Delhi, India, (2001).
- ICH, Validation of Analytical Procedures: Text and methodology (Q2(R1): International Conference on Harmonization, IFPMA, Geneva,( 2005).
- Sweetman SC, editor. Martindale, The Complete Drug Reference. 34th ed. London: The pharmaceutical press;. P.1549.( 2005)
- Budavari S, editor. The Merck Index. 13th ed. Whitehouse station, NJ: Merck & Co, Inc;. P.3504,( 2001)
- Martindale, The Extra Pharmacopoeia, Council of Royal Pharmaceutical Society of Great Britain, 29th edition, (1989).
- T. Assefa, T. Ahmed, S. Upadhyay and R. K. Upadhya., Orient. J. Chem., 29(2), 433-439, (2013).
- S. Budavari, The Merck Index, Merck and Co. Inc., White House Station, NJ, USA, 14th edition,( 1996).
- Ramakrishna NV, Vishwottam KN, Puran S, Koteshwara M, Manoj S, Santhosh M, J Chromatogr B; 809: 117-24, ( 2004)
- V. Maier, J. Horakova, J. Peter, E. Tesarova, P. Coufal, and J. Sevcik, Journal of Pharmaceutical and Biomedical Analysis, 39 no. 3-4, pp. 691–696, (2005).
- Z. Zhang, G. Yang, G. Liang, H. Liu, and Y. Chen, Journal of Pharmaceutical and Biomedical Analysis, 34, no. 3, pp. 689–693, (2004).
- V. V. Pande, Journal of Pharmacy Research, 3, p. 15,( 2009).
- M.V. Basaveswara Rao, B. C. K. Reddy, T. Srinivas Rao, and G. Venkata Rao, International Journal of Chemical Engineering Research, 1, no. 2, pp. 155–159, (2009).
- D. Patel and N. Patel, Acta Pharmaceutica, 60, no. 2, pp. 197–205,( 2010).
- G. Chandorkar, V. B. Kotwal, N. S. Dhande, S. G. Gurav, V. V. Pande, and P. V. Yadav, Pakistan Journal of Pharmaceutical Sciences, vol. 21, no. 3, pp. 307–310, (2008).
- R.N.Rao, M.V.N.Kumar Talluri, A. N. Raju, D. D. Shinde, and G. S. Ramanjaneyulu, Journal of Pharmaceutical and Biomedical Analysis, 46, no. 1, pp. 94–103, (2008).
- F. Shokraneh, A. Dubirsiaghi and N. Adib., Orient. J. Chem., 28(1), 237-241, (2012)
- M.Qi, P. Wang, and R. Cong, Chromatographia, 59, no. 3-4, pp. 251–254, (2004).
- J. G. Chandorkar, V. B. Kotwal, N. S. Dhande, S. G. Gurav, V. V. Pande, and P. V. Yadav, Pakistan Journal of Pharmaceutical Sciences, 21, no. 3, pp. 307–310, (2008).
- L. Ding, M. Li, P. Tao, J. Yang, and Z. Zhang, Journal of Chromatography B, 767, no. 1, pp. 75–81, (2002).
- S. Yamada, C. Tanaka, M. Suzuki, T. Ohkura, R. Kimura, and K. Kawabe, Journal of Pharmaceutical and Biomedical Analysis, 14, no. 3, pp. 289–294, 1996.
- K. Hanada, N. Tochikura, and H. Ogata, Biological and Pharmaceutical Bulletin, 30(8), pp. 1593–1595, (2007).


![]()


