Development and Validation of a Stability Indicating Liquid Chromatographic Method for Simultaneous Estimation of Arterolane Maleate and Piperaquine Phosphate in Combined Dosage Form
1 Reasearch Scholars, Department of Pharmaceutical sciences, Jawaharlal Nehru Technological University, Hyderabad, Andhra Pradesh, India
2Principal, Sanskruthi College of Pharmacy, Ghatkesar, Hyderabad, Andhra Pradesh, IndiaDOI : http://dx.doi.org/10.13005/ojc/290412
Download this article as:
![]()
A novel stability indicating isocratic, reversed phase-liquid-chromatographic method has been developed for the simultaneous quantitative determination of Arterolane maleate And Piperaquine phosphate in combined-dosage form. A thermo hypersil BDS C18 (250*4.6*5µ) column with mobile phase containing water pH 2.8 adjusted with ortho phosphoric acid: methanol in the ratio of (60: 40, v/v) was used. The flow rate was 1.0 mL/min, column temperature was 30°C and effluents were monitored at 241 nm. The retention times of Arterolane Maleate and Piperaquine Phosphate were 1.864min and 3.047min, respectively. Correlation co-efficient for Arterolane Maleate and Piperaquine Phosphate was found to be 0.99 and 0.99, respectively. The proposed method was validated with respect to linearity, accuracy, precision, specificity, and robustness. Recovery of Arterolane Maleate and Piperaquine Phosphate in formulations was found to be in the range of 97-103% and 97-103% respectively confirms the non-interferences of the excipients in the formulation. Arterolane Maleate and Piperaquine Phosphate were exposed to stress conditions like acidic hydrolysis, basic hydrolysis, oxidative, photolytic, humidity and thermal conditions. Due to its simplicity, rapidness and high precision, the method was successfully applied to the estimation of Arterolane Maleate and Piperaquine Phosphate in combined dosage form.
KEYWORDS:Arterolane Maleate; Piperaquine Phosphate; Method validation; Forced degradation
INTRODUCTION
Malaria is a major public health problem infecting 300-500 million people worldwide and causing more than one million deaths annually globally. An endemic protozoal disease in India with an estimated 70-100 million cases each year, Plasmodium falciparum is responsible for half of these cases. Fixed dose combination of arterolane maleate (150 mg) and piperaquine phosphate (750 mg) has been recently approved by FDA as a once-a day therapy for three days for the treatment of acute, uncomplicated Plasmodium falciparum malaria3.
Arterolane maleate (AM), chemically [(N-(2-amino-2-methylpropyl)-2-cis-dispiro(adamantan e-2,3′-[1,2,4]trioxolane-5′,1″-cyclohexan)-4″-yl] acetamide is a synthetic trioxolane, easy to synthesize, affordable and rapidly acting oral antimalarial. It is a rapidly acting blood schizonticide against all blood stages of P. falciparum without effect on liver stages. Arterolane is an active moiety which gets accumulated either in cytosol or food vacuole of the parasite.
It acts by inhibition of PfATP6, a sarcoplasmic endoplasmic reticulum calcium ATPase encoded by P. Falciparum. In the food vacuole of parasite reductive cleavage of peroxide bond of arterolane by ferrous iron (fenton reaction) occurs. This irreversible redox reaction produces free radicals that alkylate the membrane associated parasite proteins.
The reactive species inhibits an ATP-dependent Ca2+ pump1 located on the endoplasmic reticulum, PfATP6. The pump, called PfATP6, is a homologue of a mammalian sarcoplasmic /endoplasmic reticulum Ca2+ ATPase (SERCA). The reactive C radicals are thought to subsequently react more or less indiscriminately with different protein targets as well as with ferriprotoporphyrin IX itself, thus preventing heme detoxification and inhibiting a multitude of enzymes.
Piperaquine phosphate (PIP), chemically 1,3-bis-[4-(7-chloroquinolyl-4)-piperazinyl-1]-propane phosphate, is is a bisquinoline anti-malarial drug and shows good activity against chloroquine-resistant Plasmodium strains. Evidence suggesting the inhibition of the heme-digestion pathway in the parasite food vacuole is most convincing. Piperaquine’s bulky bisquinoline structure may be important for activity against chloroquine resistant strains and may act by inhibition of the transporters that efflux chloroquine from the parasite food vacuole.
Arterolane kills the malaria parasite in the blood, providing fast relief from symptoms of malaria like fever and chills. Piperaquine, on the other hand, has a longer-lasting effect than arterolane and kills residual parasites, preventing the recurrence of malaria.
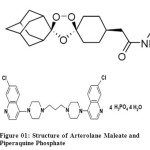 |
Figure 01: Structure of Arterolane Maleate and Piperaquine Phosphate Click here to View figure |
A literature survey revealed few liquid chromatography (LC) assay methods that have been reported for the determination of Arterolane in bulk dug and pharmaceutical dosage forms, but there are no reported methods for simultaneous estimation of Arterolane maleate and Piperaquin phosphate in combined pharmaceutical dosage forms [3-11].
The present International Conference on Harmonization (ICH) drug stability guidelines suggest that stress studies should be conducted on the drug product to establish its inherent stability characteristics, and the analytical method should able to separate all degradation impurities formed under stress studies to prove its stability-indicating power. In order to monitor possible changes to a product over time, the applied analytical chromatographic method must be stability-indicating. The best case for testing the suitability of a method is using real-time stability samples containing all relevant degradation products that might occur. But due to product development timelines, process characteristics, excipients, and other environmental factors, a forced degradation study (stress test) can serve as an alternative.
The aim of the present work is to focus on the development of an efficient stability indicating liquid chromatographic method for simultaneous estimation of Arterolane Maleate and Piperaquine Phosphate in combined pharmaceutical dosage form such as Tablets in presence of its excipients and degradation products in a short chromatographic run.
EXPERIMENTAL (MATERIALS AND METHODS)
Instrumentation:
The separation was carried out on HPLC system with Waters 2695 alliance with binary HPLC pump, Waters 2998 PDA detector, and Waters Empower2 software and thermo hypersil BDS column (250mmx4.6mm, particle size 5µm).
Chemicals and Reagents:
Arterolane Maleate and Piperaquine Phosphate were taken as a gift sample from Dr. Reddy’s Laboratories Ltd., Hyderabad. Methanol of HPLC grade was purchased from E. Merck (India) Ltd., Mumbai. Orthophosphoric acid of AR grade was obtained from S.D. Fine Chemicals Ltd., Mumbai and milli Q water.
HPLC Conditions:
The mobile phase consisting of water (pH 2.8 adjusted with orthophosphoric acid) and methanol (HPLC grade) were filtered through 0.45µ membrane filter before use, degassed and were pumped from the solvent reservoir in the ratio of 60:40 v/v was pumped into the column at a flow rate of 1.0ml/min. The column temperature was 30°C. The detection was monitored at 241nm and the run time was 5min. The volume of injection loop was 10µl prior to injection of the drug solution the column was equilibrated for at least 30 min. with the mobile phase flowing through the system.
Preparation of Standard solution
Accurately weighed quantity, 150.0 mg of Arterolane maleate and 750mg of Piperaquine Phosphate was transferred into a 100 ml of volumetric flask and 30 ml of water was added followed by sonication for 15 minutes and make up the volume with water. 5 ml of above solution was taken into 25ml volumetric flask and diluted to the mark with water.
Preparation of Sample solution
Accurately weighed quantity, 1320mg of sample powder was transferred into 100ml of volumetric flask added 25ml of water and sonicated for 30mins and make up the volume with water and filtered through the 0.45µm filter paper Transfer above solution 5ml into 25 ml volumetric flask and make up the volume with water.
Statistics:
Results are presented as the mean±SD and results were analyzed using Excel® 10, and Chromeleon®. A p value < 0.05 was considered as significant.
RESULTS AND DISCUSSION
The analytical procedure for the estimation of Arterolane maleate and Piperaquine phosphate in marketed formulation was optimized with a view to develop a precise and accurate assay method. Various mobile phase systems were prepared and used to provide an appropriate chromatographic separation, but the proposed mobile phase containing water (pH 2.8 adjusted with orthophosphoric acid) Buffer:
Methanol in the ratio of 60:40 (v/v) gave a better resolution. Using UV-visible PDA detector at 241 nm carried out the detection. Amongst the several flow rates tested, the flow rate of 1 ml/min was the best for all the drugs with respect to location and resolution of peaks. The retention time of Arterolane maleate and Piperaquine phosphate was found to be 1.864min and 3.047min respectively. The chromatograms of standard and sample solution of Arterolane maleate and Piperaquine phosphate were shown in figure 02 and 03 .The asymmetry factor of Arterolane maleate and Piperaquine phosphate was 0.984 and 0.989 found to be respectively, which indicates symmetrical nature of the peak. The percentage label claim of individual drugs found in formulations were calculated and presented in table 01.The results of analysis shows that the amounts of drugs estimated were in good agreement with the label claim of the formulations.
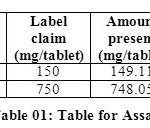 |
Table 01: Table for Assay Click here to View table |
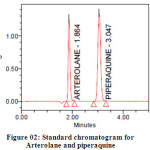 |
Figure 02: Standard chromatogram for Arterolane and piperaquine Click here to View table |
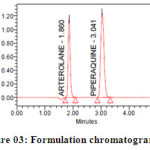 |
Figure 03: Formulation chromatogram for Arterolane and piperaquine Click here to View figure |
Arterolane and piperaquine
METHOD VALIDATION
System Suitability12 Studies:
The column efficiency, resolution and peak asymmetry were calculated for the standard solutions (Table 02). The values obtained demonstrated the suitability of the system for the analysis of this drug combinations, system suitability parameters may fall within ± 3 % standard deviation range during routine performance of the method.
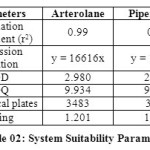 |
Table 02: System Suitability Parameters Click here to View table |
Specificity:
Specificity is the ability to assess unequivocally the analyte in the presence of components which may be expected to be present. Typically these might include impurities, degradants, matrix, etc. The specificity was established by preparing an Arterolane Maleate and Piperaquine Phosphate standard at 0.5% level of test concentration and injected 6 times into HPLC system as per the test procedure.
ACCURACY AND PRECISION
The accuracy of the method was determined by recovery experiments. From the data obtained, added recoveries of standard drugs were found to be accurate (Table 04 & 05). Repeatability was checked by injecting six individual sample preparations. Percent RSD of the area for each drug was calculated
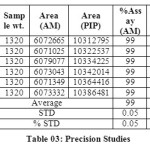 |
Table 03: Precision Studies Click here to View table |
LINEARITY AND RANGE
The linearity of the method was determined at five concentration levels. The calibration curve was constructed by plotting response factor against concentration of drugs. The slope and intercept value for calibration curve was y = 16616x (R2=0.99) for Arterolane maleate and y = 19288x (R2=0.99) for piperaquine phosphate. The results shows that an excellent correlation exists between areas and concentration of drugs within the concentration range indicated above. The overlay chromatograms of Linearity for Arterolane maleate and piperaquine phosphate shows in Fig 4 and the results for calibration curves are given in Fig 5
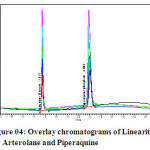 |
Figure 04: Overlay chromatograms of Linearity for Arterolane and Piperaquine Click here to View figure |
LIMIT OF DETECTION & LIMIT OF QUANTIFICATION (LOD & LOQ):
Limit of quantification and detection were predicted by plotting linearity curve for different nominal concentrations of Arterolane maleate and piperaquine phosphate. Relative standard deviation (σ) method was applied, the LOQ and LOD values were predicted using following formulas (a) and (b).
(a) LOQ = 10 σ / S
(b) LOD = 3.3 σ / S
Where σ = residual standard deviation of response S = slope of the calibration curve
LOD and LOQ for Arterolane maleate and Piperaquine phosphate are found to be 2.980, 9.934 and 2.909, 9.696 respectively (Table 06).
ROBUSTNESS
Robustness of the method was determined by making slight changes in the chromatographic Conditions. It was observed that there were no marked changes in the chromatograms, which Demonstrated that the RP HPLC method developed is rugged and robust (Table 07 & 08)
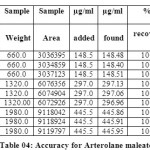 |
Table 04: Accuracy for Arterolane maleate Click here to View table |
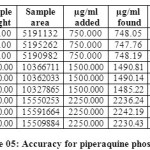 |
Table 05: Accuracy for piperaquine phosphate Click here to View table |
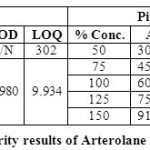 |
Table 06: Linearity results of Arterolane and piperaquine: Click here to View table |
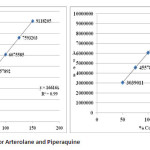 |
Figure 05: Linearity Curve for Arterolane and Piperaquine Click here to View figure |
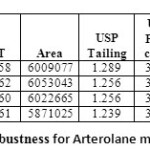 |
Table 07: Robustness for Arterolane maleate Click here to View table |
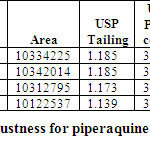 |
Table 08: Robustness for piperaquine phosphate Click here to View table |
FORCED DEGRADATION STUDIES:
The stability studies were determined by applying the physical stress (acid, base, peroxide, water and light) to the product. It was observed that there were marked degradation in the chromatograms, and the data given in table-09 & 10).
Based on the results of the stress studies, the degradation behavior of Arterolane Maleate and Piperaquine Phosphate is as follows.
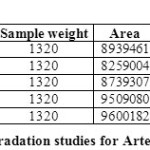 |
Table 09: Degradation studies for Arterolane maleate Click here to View table |
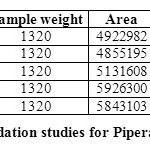 |
Table 10: Degradation studies for Piperaquine phosphate Click here to View table |
Acid degradation:
Arterolane maleate and Piperaquine Phosphate were stable to degradation in 5 N HCl at 700C for 10 min moderately. The impurities formed during this study are well separated from main drug peaks and mass balance is found to be in acceptable limit. Peak purity of drugs also matches (Figure 06)
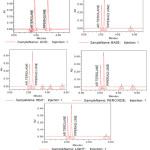 |
Figure 06: Typical chromatograms of Forced degradation studies Click here to View figure |
Base degradation:
Arterolane Maleate and Piperaquine Phosphate were found to be slightly unstable in 5 N NaOH at 700C for 5 min. The major degradation peaks are well separated from drug peaks and well resolved. Mass balance is found to be in acceptable limit. Peak purity of drugs also matches (Figure 06).
Oxidation degradation:
Arterolane Maleate and Piperaquine Phosphate were found to be slightly unstable under conditions of 3% hydrogen peroxide at 700C for 10 min. The major impurities in the study were resolved with drug peaks. Mass balance is found to be in acceptable limit. Peak purity of drugs also matches (Figure 06).
Thermal degradation
Arterolane Maleate and Piperaquine Phosphate were found to be stable to thermal exposure. Partial degradation was take place. Impurities formed well resolved from main drug peaks. Mass balance is
found to be in acceptable limit. Peak purity of drugs also matches (Figure 06).
Photolytic degradation
Upon subjecting Arterolane Maleate and Piperaquine Phosphate samples to both UV and visible light, only partial degradation of was observed (Figure 06).
Testing of a placebo containing preservative leads to formation of number of different impurities with respect to an unstressed placebo. The amount of preservative decreased mainly by influence of oxidation, light and acid. Mass balance of preservative shows almost 100%. The active ingredients remain almost stable within tested period and mass balance matches (Table 09&10)
System suitability results were given by table 01 and system suitability parameters are retention time, resolution, tailing and plate count were shown uniformity and %RSD was less than 1 so we can say system is suitable for analysis method specificity was concluded by fig:1 and fig:2 those figures are Arterolane maleate and piperaquine phosphate standard chromatogram and other one is formulation they were not observed placebo and excipients peaks interference with standard and analytic peak so it proves method is selective. The result given in table 2 says that the method precision passed for both Arterolane maleate and piperaquine phosphate studies.
The method accuracy was evaluated by recovery studies. Arteorlane maleate and piperaquine phosphate recovery was found to be 100% as per ICH 97%-103% and also percentage RSD was very low so method is accurate shown in table 4&5. Linearity calibration curve was given below fig: 5 and plot the graph three different concentrations versus areas to construct the linear regression equation and to calculate the value of correlation coefficient. Linear correlation was found to be Y= 16616 for Arterolane maleate and y = 19288 for piperaquine phosphate the intraday and inter day variations was calculated in terms of %RSD and results was found to be intraday and inter day respectively. Method robustness results were given by table 7&8. Stability studies are given in table 9&10.
CONCLUSION
The proposed HPLC method was found to be simple, precise, accurate and sensitive for the simultaneous estimation of Arterolane maleate and piperaquine phosphate in pharmaceutical dosage forms. Hence, this method can easily and conveniently adopt for routine quality control analysis of Arterlane maleate and piperaquine phosphate in pure and its pharmaceutical dosage forms.
ACKNOWLEDGEMENT
Author thank full to department of Pharmaceutical sciences in Jawaharlal Nehru Technological University, Hyderabad and Rainbow pharma training lab, Kukatpally, for providing instruments and analytical support. Authors are also thankful to Dr.Reddys laboratories for providing the Arterolane maleate and Piperaquine phosphate as gift samples for our research purpose.
REFERENCES
- Tripathi, K.D., Essentials of Medical Pharmacology, 6th ed. Jaypee Brothers Medical Publishers, 2008, pp 780-98.
- Vaijanath, G., Pravin, P. Karmuse, Pradeep D. Ghugare, Characterization and quantitative determination of impurities in piperaquine phosphate by HPLC and LC/MS/MS, Journal of Pharmaceutical and Biomedical Analysis, 2007,43, pp 186–195.
- World Health Organization, World malaria report 2008, Document WHO/HTM/GMP/2008, Geneva, http://www.who.int/malaria/wmr2008/malaria2008.pdf.
- Tarning J, Singtoroj T, Annerberg Ashton AM, Bergqvist Y, White NJ, Development and validation of an automated solid phase extraction and liquid chromatographic method for the determination of in urine, Journal of Pharmaceutical and Biomedical Analysis, 2006, 41, 1(11), 213-18.
- Te-Yu Hung, Davis TEM, Ilett KF, Measurement of piperaquine in plasma by liquid chromatography with ultraviolet absorbance detection, Journal of Chromatography B, 2003, 791, 1(2), 93-101.
- Wahajuddin, Raju KSR, Taneja I, Bioanalysis of antimalarials using liquid chromatography, TrAC Trends in Ana Chem, (2013), 42, 186-204.
- Lindegardh N, Annerberg A, White NJ, Day NJP, Development and validation of a liquid chromatographic-tandem mass spectrometric method for determination of Piperaquine in plasma: Stable isotope labeled internal standard does not always compensate for matrix effects, Journal of Chromatography B, 2008, 862, 1(2), 227-36.
- Hodel EM, Zanolari B, Mercier T, Biollaz J, Keiser J, A single LC–tandem mass spectrometry method for the simultaneous determination of 14 antimalarial drugs and their metabolites in human plasma, Journal of Chromatography B, 2009, 877, 10(1), 867-86.
- Kirchhofer C, Keiser J, Huwyler J, Development and validation of a liquid chromatography/mass spectrometry method for pharmacokinetic studies of OZ78, a fasciocidal drug candidate, Journal of Chromatography B, 2010,878, (28), 2770-74.
- Amin NCC, Blanchin MD, Ake M, Fabre H, Capillary electrophoresis methods for the analysis of antimalarials. Part II. Achiral separative methods, Journal of Chromatography A, 2013, 1276, 1-11.
- Abhishek G, Yogendra S, Srinivas KS, Garima J, Sreekumar VB, Development and validation of a headspace gas chromatographic method for the determination of residual solvents in arterolane maleate bulk drug. J Pharm Bioallied Sci. 2010;2(1):32.
- International Conference on Harmonisation (ICH) of technical requirements for registration of pharmaceuticals for human use: Validation of analytical procedures: Text and methodology Q2 (R1), 2005.


![]()


