Characterisation of Kapiri Mposhi Aluminosilicate Minerals
MARINA G. XAVIER1, SAMUEL F. BANDA1 and CHRISTOPHER C. CHAMA2
1Department of Chemistry, University of Zambia, P.O. Box 323739, Lusaka, Zambia 2Department of Metallurgy and Mineral Processing, University of Zambia, P.O. Box 32379, Lusaka, Zambia
DOI : http://dx.doi.org/10.13005/ojc/290460
Article Received on :
Article Accepted on :
Article Published : 15 Jan 2014
Zeolites have become recognized as the most important authigenic silicates in sedimentary rocks of volcanic origin. Along with smectites and other clay minerals, they are sensitive indicators of geochemical reactions on rocks. However, there have been few investigations on the chemistry, origin, and applications of zeolites. This study aims to characterize the zeolite group of minerals with respect to composition, crystal structure and physical properties. X-ray diffraction, scanning electron microscopy and wet chemical analysis have been used to characterize the Kapiri Mposhi aluminosilicate minerals. The characterization indicates that the major component in the mineral is calcium aluminium oxide. Loss on ignition was found to be 0.22%. Thermal analysis revealed the existence of an endothermic peak at 100-300oC due to dehydroxylation and this was accompanied by 30% mass loss.
KEYWORDS:zeolites; mineralogy; thermal analysis; morphology
Download this article as:| Copy the following to cite this article: Xavier M. G, Banda S. F, Chama C. C. Characterisation of Kapiri Mposhi Aluminosilicate Minerals. Orient J Chem 2013;29(4) |
| Copy the following to cite this URL: Xavier M. G, Banda S. F, Chama C. C. Characterisation of Kapiri Mposhi Aluminosilicate Minerals. Orient J Chem 2013;29(4). Available from: http://www.orientjchem.org/?p=1662 |
INTRODUCTION
Zambia’s amazingly wide spectrum of natural resources spans a range of minerals from gemstones to industrial minerals. The industrial mineral potential of Zambia remains largely unexploited except for copper. As concerns industrial minerals, silica sand of varying quality occurs throughout Zambia but no resource information exists except for that on the silica sand deposits near Kapiri Mposhi in central Zambia (this town was the source of raw material for glass manufacture by Kapiri Mposhi Glass Products Ltd). This locally available silicate rich mineral together with the industrial waste from the glass plant closely resembles zeolites, the natures’ little trap. This high-grade silica sand deposit was formed by in situ weathering of the Muva-age quartzites and subsequent leaching to remove iron and clay minerals. Aluminosilicate minerals
usually results from weathering of feldspar group of mineral (K, Na)AlSi3O8 or Ca(Al2Si2O8). Feldspar bearing pegmatites have been found in Kapiri Mposhi. The chemical composition of the Kapiri Mposhi zeolite and the class to which it belongs is not yet known. This mineral which is a good adsorbent [1] has applications in reducing toxic waste and adverse effects arising from environmental pollution. The characterization and hence the understanding of the aluminosilicate is essential in underpinning the anticipated growth in the mining, manufacturing and agricultural sectors. It should be noted that exploitation of this promising mineral has potential sound management of the environment and of public health.
The demand for feldspar in the past has been from ceramic material producers such as Kapiri Mposhi Glass Products Ltd. and the source has been a 5 m thick partially kaolinised pegmatite deposit at Shipingu, 7 km south of Kapiri Mposhi. The pegmatite contains partially kaolinised alkali-feldspar, with intergrown quartz and abundant mica of apparently substandard quality. Their occurrence in earths crust, however, is not as well known and has received little attention by chemists and geologists. It is commonly known that post depositional, diagenetic alteration of volcanic glass and subsequent crystallization of zeolites from percolating solutions is common in tuffaceous sediments under specific physiochemical conditions [2]. In saline, alkaline lake deposits highly reactive volcanic ash (glass) transforms via a dissolution-reprecipitation mechanism to assemblages of fine grained zeolite. The most commonly reported zeolites in sedimentary environments are analcime, chabazite, natrolite, clinoptilolite, erionite etc, but clinoptilolite probably is the most abundant [3]. It has been observed that ground water percolating through columns of volcanic ash became increasingly enriched in dissolved Al and Si as well as in various alkali and alkaline earth cations. Al and Si bearing phases are dissolved during different stages of zeolitization (glass > quartz > mullite) [4]. Unfortunately, there is very little published information of geological occurrence of zeolites in Zambia. Therefore, it is hoped that this paper will make a contribution to the database of zeolite and provide an incentive for future investigations.
EXPERIMENTAL
PROCEDURES Mineralogical identification was conducted in a Philips XPERT-PRO X-ray diffractometer system. Samples were ground using a swill mill and the powdered sample was packed onto standard aluminium slide holders. CuKα1 radiation was used with the variable instrument settings (30.6- 40.0 kV voltage, 20-30 mA current). Chemical composition (both major and trace elements) of the sample was determined using Atomic Absorption Spectroscopy (AAS) and X- ray Flouresence (XRF). A Genesys 10 Ultra Violet Spectrometer was used to detect Sulphur and Phosphorous in the sample. About 1g of the mineral was ashed at 450oC. After cooling, the sample was digested in 15 ml concentrated hydrochloric acid, diluted to 50 ml and was read on the calibrated Atomic Absorption Spectrometer, Model spectra 50. Silicon content was estimated gravimetrically.
The structure of natural zeolites were observed in the Zeiss EVO 18 scanning electron microscope (SEM). The samples were sputter-coated with an Au–Pd mixture to ensure conductivity. Total pore space (T.P.S) was determined as a calculation based on the bulk and particle density [5]. The T.P.S. is the percentage of the bulk volume, not occupied by solids or
T. P. S = Total Bulk Volume – Volume Occupied by Solids (1)
By measuring the gravity-induced settling velocities of different size particles in a liquid with known properties, the particle sizes were determined. The rate at which nonporous particles fall through a liquid is described by Stokes’ Law as

where Dst = Stokes’ diameter (m), η = fluid viscosity (kg/ms), ρs = density of the solid (kg/m3), ρι = density of the liquid (kg/m3), v = settling velocity (m/s) and g = acceleration due to gravity (m/s2)
Differential thermal analysis (DTA) and Thermogravimetric analysis (TGA) analyses were conducted in a Shimadzu TGA 51H at a 10oC heating rate up to 1000oC. The flowing gas was N2 with a flow rate of 40 ml/min.
RESULTS AND DISCUSSION
Mineral Identification: The X- ray diffraction (XRD) pattern is shown in Fig 1.The XRD patterns of zeollites generally consist of sharp, narrow diffraction peaks, suggesting materials with high degrees of crystallinity. XRD peaks can show impurity peaks due to inhomogenity or heterogeneous dispersion.
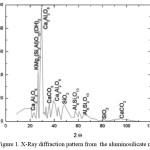 |
Figure 1. X-Ray diffraction pattern from the aluminosilicate mineral Click here to View figure |
In addition, zeolites in geologic formations are commonly associated with quartz, opal-CT, feldspar, smectic, gypsum and unreacted volcanic glass, the XRD peaks of which may overlap with those of zeolites. Of special concern is the overlap of peaks of plagioclase and alkali feldspars with those of many zeolites. Principal reflection of cristoballite (opal CT) is close to major peak of clinoptilolite near 2θ = 29o, hence if quartz is a major constituent of the sample, minor quantities of other zeolites will be missed. There are no broad humps produced by noncrystalline volcanic glass between about 2θ = 18o and 28o which can obscure certain zeolite peaks in this region. The most intense peak is at 2θ = 29.39 o
value is due to Calcium Aluminium Oxide (Ca3Al2O6)which can also be mistaken for crystoballite. The next intense peak is for phlogopite (KMg3(Si3Al)O10(OH)2). Peaks for mullite and calcite are also indicated in Figure 1. The relatively narrow peaks indicate high crystallinity of the mineral. Zeolite minerals for the most part yield characteristic XRD peaks that allow easy distinction among the several members of the group and other common constituents of rocks and minerals. The XRD peaks in Figure 1 can be used to calculate the size of crystals by using Scherrer’s formula.

where D = grain size of crystals, λ = x-ray wavelength (1.5405Å), β = the broadening of diffraction line measured at half its maximum intensity in radians and θ = half angle of diffraction. Using Equation (3), the size of the Ca3Al2O6 grains was found to be 20840 nm; this is very close to that reported in literature [6]. However, a major limitation of equation (3) is that it can be used to calculate only one grain size and thus may not accurately reflect the sizes of crystals that are not monosized.
Chemical Analysis: The elemental composition of the sample investigated using XRF/AAS is given in Table 1. The results indicate that the sample was rich in Al2O3 and SiO2, which corresponded to the presence of high levels of quartz and kaolinite in the clay. This indicates that the bulk of the samples consisted of SiO2 which is derived from quarts and clay minerals, such as kaolinite, K-bearing aluminosilicates and montmorillonite. The second largest contributor was Al2O3 which corresponded to the presence of high amounts of clay minerals. The Fe2O3 can be related to the pyrite present in the clay samples or it can be the rare case of replacement of Si with Fe instead of Al in a zeolite. A significant fraction of the sample also contained sulphur indicating the presence of sulphur bearing species like sulphates. Elements found in minor amounts are Na, K, Cu, Pb, Cr, Ni, Mg, V, Nb, Sr, Zr, As, and Bi; Oxygen in the form of metal oxide accounts for the remainder. The residue from industrial waste of glass manufacture usually showed elevated levels of Zr, Sr, Cr, Cu, Mg, Zn, Fe, Ba, V, and Mn. From the spectroscopic studies it can be concluded that the exchangeable ions present in the zeolite are Na, K, Ca, Mg etc. The high Si/Al ratio predicted using wet analysis can be related to the thermal stability and high hydrophobicity of the natural zeolite. From the iron and sulphur content it can be inferred that natural zeolites are contaminated by Fe2+ and SO42-. Sample seems to resemble clinoptilolite with a higher % of impurities.
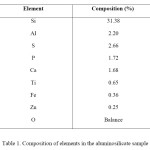 |
Table 1. Composition of elements in the aluminosilicate sample Click here to View table |
Morphological Features: The surface morphologies of the sample as observed in the SEM are shown in Figure 2. In these images the darker portions refer to cavities and lighter portion to grains. The mineral consisted of spherical particles (region A) of varying sizes. In addition, other particles had a plate-like morphology (region B). In calculating grain sizes from either Equation (2) or (3), this difference in particle morphology is unaccounted for. Both of these equations would indicate that the particle size that is measured is a “diameter” (i.e. spherical particles are in existence). Due to the limited resolution of scanning electron microscope, it is not possible to observe if any finer micrconstituents are present within the aluminosilicate grain structure. Impurities such as quartz and cristoballite were also present on the XRD pattern in Figure 1. Note that cristoballite is simply another form of quartz (SiO2).
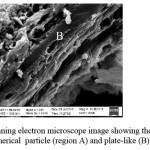 |
Figure 2: Scanning electron microscope image showing the existence of spherical particle (region A) and plate-like (B) morphologies. Click here to View figure |
Particle Density and Particle Size Distribution: Particle size analysis is an important tool in determining the reactivity, flow characteristics, fusion qualities and shrinkage of aluminosilicates. The experimentally calculated densities and the corresponding T.P.S are tabulated in the Table 2.

From the percentage of sand, silt and clay calculated, it has been determined from the United States Department of Agriculture (USDA) classification that the aluminosilicate mineral in this study is Sandy Loam. Particle sizes determined using hydrometer are also shown in the table. The grain sizes in Table 2 for sand, clay and silt were calculated from Equation 2.
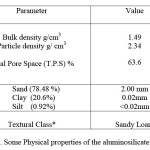 |
Table 2. Some Physical properties of the aluminosilicate mineral *United States Department of Agriculture classification Click here to View table |
The higher the T.P.S the smaller the pore size and larger the water holding capacity. As T.P.S increases the mineral texture becomes finer and greater the diversity of pore sizes and shapes as evident from particle size distribution (PSD). Although the density of individual soil minerals has a considerable range, the measured particle density of mineral soils is fairly constant and varies from 2.6 to 2.7 g/cm3. Quartz, feldspar and colloidal silicates make up the major portion of mineral soils and their densities fall within this range. When unusual amounts of heavy minerals such as magnetite, zircon or tourmaline are present the particle density of the soil is higher [7]. Pores are usually filled with air and water. The arrangement of solid particles determines the amount of pore space. Sandy soils have a range of 35 to 45% T.P.S, while finer textured soils vary from 40 to 60% T.P.S. Compacted soil may drop to as low as 30% total pore space. The measured particle size distribution is a function of the particle skeletal density. The skeletal density is the mass of discrete pieces of solid material divided by the volumes of the pieces and closed (or blind) pores within the pieces. The three-dimensional framework structures of quartz and feldspar are relatively dense and tightly packed (ρ = 2.6-2.7 mg/ m3), those of zeolite minerals are remarkably open (ρ = 2.1-2.2 mg/m3), and void volumes of dehydrated species as great as 50% are known. The bulk densities of zeolitically altered volcanic tuffs and pyroclastics range from about 0.8 to 2.5 mg/m3, reflecting the porosity. The porous nature of zeolite structures is readily apparent from these illustrations. The finer the particle size of a mineral the better the access to the surface area and faster the rate of adsorption kinetics. Particle size distribution or texture is something which influences the physical and chemical properties of a mineral. As particle size decreases, total surface area, better known as specific surface area increases.
The organic matter including carbon in the sample was estimated using Walkley-Black wet combustion method. The organic carbon was found to be 0.28% and total organic matter was found to be 0.48%. Loss-on-ignition (LOI) of the clay sample is 0.22% and it was found by calculating the loss of mass after ignition at 900-1000oC. The percentage mass lost on ignition gives an appreciable crude measure of the organic content of the sediment. Organic matter in a zeolite mineral behaves like a sponge enhancing the adsorption capacity and permeability. Presence of clay and organic matter also increase cation exchange capacity (CEC) of the zeolite. Organic matter increases the T.P.S forming aggregates with less compaction. Factors such as sample size, exposure time and position of samples in the furnace affected LOI results, with LOI at 550°C being more susceptible to these factors than LOI at 950°C. Percentage of insoluble residue was found by digesting and then igniting the sample in a tared crucible at 1000oC. It was found to be 1.84%. This residue material affects the properties of the mineral especially its compressive strength.
Thermal Analysis (DTA/TGA): The TGA and DTA were used to verify the thermal degradation temperature of the mineral sample, to evaluate the thermal stability of oxide and to quantify the aluminosilicate mineral content in the sample. The TGA/DTA curves of the aluminosilicate sample are shown in Figure 3. Zeolite structure never breaks down under extreme pressures and requires temperatures that melt glass to break down. As many mass loss curves may look similar, the mass loss curve require transformation before results may be interpreted. A derivative mass loss curve can identify the point where mass loss is most apparent. Again, interpretation is limited without further modifications and deconvolution of the overlapping peaks is required. Derivative thermogram (DTG) plots changes in mass with temperature, dm/dt and resolves changes more clearly related to the major TGA derivative signal. The first endothermic peak on DTA curve located around 100-300oC and associated mass loss observed corresponds to the release of physisorbed water and the pore liquor. The exothermic peak with an onset around 600oC could be assigned to the removal of organic residues. The high temperature exotherm also implies nucleation of mullite or crystallisation of crystoballite. The mass percentage of the mineral was estimated from the difference in percentage mass at the beginning and at the end of each DTA run. The middle portion of TGA curve, between 50-200oC represents desorption of loosely bound zeolite water and high temperature portion, from 200-700oC, represents the loss of tightly bound zeolite water. It should be remembered that water adsorbed in an adsorbent can be classified as external water, loosely bound water and tightly bound water. TGA denotes a total of 30% mass loss. The thermal events at 700 to 800oC correspond to the decomposition of sulphate or phosphate which manifests as an exotherm around 750oC in DTA and also as a derivative signal of TGA.
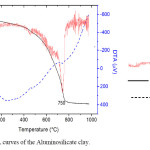 |
Figure 3. TGA/DTA curves of the Aluminosilicate clay. Click here to View figure |
CONCLUSIONS
The crystallographic structure of the aluminosilicate minerals were studied by X- ray diffraction. The major oxide detected is calcium aluminium oxide in association with minor amounts of silica as an impurity. Chemical analysis revealed that the mineral is rich in SiO2 and Al2O3. Bulk density was found to be less than particle density confirming the porous nature of zeolitic structure. Loss on ignition which is roughly equal to the amount of organic matter present was found to be 0.22%. Thermogravimetry has been used to evaluate the thermal stability of the oxide. The endothermic peak from 100-300ºC temperature range, which occur for the sample is mainly due to dehydroxylation and is
associated with the weight loss of 30% which is clear from the corresponding TGA curve. Major endothermic and exothermic events corresponding to water loss and decomposition of sulphate are identified in DTA.
ACKNOWLEDGEMENTS
The authors express their sincere thanks to Mr. Anthony Lloyd, Konkola Copper Mines in Chingola, Zambia and to members of Geological Survey Department, Zambia. Special acknowledgement to the help rendered by members of National Institute of Interdisciplinary Science and Technology (NIIST), Thiruvananthapuram, India.
REFERENCES
- Xavier G.Marina and Banda S.F, Adsorption and desorption studies of various solvents on selected Zambia Kapiri Mposhi zeolite samples, Material Science Research India, Vol 6
- 257-261(2009), www.materialsciencejournal.org 2. Foct F, Bouvier O.de and Magnin T, Metall.Mater.Trans. 31A (2000) 2025-2036.
- Bouchaud. E, Kubin.L, and Octor. H, Metal. Trans. 22A (1991) 1021-1028
- Barret C. S, Massalski T. B. Structure of Metals, Pergamon Press, Oxford, 1980.
- Blake G.R. (1965) – Particle density, bulk density. In Clark C.A. (ed.) Methods of Soil Analysis, Agronomy 9, part 1, 371-390, American. Society. Agron, Madison, Wis.
- Mumpton F.A and Sand L.B, eds., Pergamon press, Elmsford, NewYork, 546PP
- Wipplenger. P.E and horn.G.F.J. (1998) Zeolite minerals, In: The mineral Resources of South Africa. Handbook 16, Council for Geoscience. Wilson.M.G.C and Anhaeusser. C.R. eds, pp.

This work is licensed under a Creative Commons Attribution 4.0 International License.
![]()
A New Edition of Web of Science
Journal Impact Factor
2022: 0.5
Five Year: 0.8
Journal is Indexed in

Cabells Whitelist
![]()


