Appraisal of mineral and heavy metal contents in Peach and Grape grown at Some Major Agricultural Companies in Saudi Arabia
Saad F. Alshammary1*, Okla S. Al-Horayess2
1National Center of Agriculture Technology (NCAT), King Abdulaziz City for Science and Technology (KACST), P. O. Box 6086 Riyadh 11442,Saudi Arabia. 2National Center of Radioactive Waste Management (NCRWM), King Abdulaziz City for Science and Technology (KACST), P. O. Box 6086 Riyadh 11442,Saudi Arabia.
DOI : http://dx.doi.org/10.13005/ojc/290430
Article Received on :
Article Accepted on :
Article Published : 08 Jan 2014
Extensive use of inorganic fertilizers, insecticides and herbicides may toxic for plants and cause human health problems.Mineral concentrationsdeterminedin peach and grape of three major agricultural Saudi companies.Minerals Concentrationin peach and grape ranged from 17.43-22.54 mg/kg (Cu), 146-209 mg/kg (Fe), 7.35-11.85 mg/kg (Mn), 11.08-14.62 (Zn), 26.8-25.5 mg/kg (Mg), 122- 177 mg/kg (Ca) and 0.025- 0.18 mg/kg (Cd), 8.22- 12.85 mg/kg (Cu), 109-192 mg/kg (Fe), 7.05-10.15 mg/kg (Mn), 20.31-25.22 mg/kg (Zn), 37.5- 38.3 mg/kg (Mg), 182-302 mg/kg (Ca) and 0.019- 0.12 mg/kg (Cd), respectively. Concentration of (Cu, Fe, and Cd)infruits was higher than permissible limits.
KEYWORDS:Fruits; heavy metals; environmental pollution; Provisional tolerable daily intake (PTDI); Tolerable daily upper intake level (UL).
Download this article as:| Copy the following to cite this article: Alshammary S. F, Al-Horayess O. S. Appraisal of mineral and heavy metal contents in Peach and Grape grown at Some Major Agricultural Companies in Saudi Arabia. Orient J Chem 2013;29(4) |
| Copy the following to cite this URL: Alshammary S. F, Al-Horayess O. S. Appraisal of mineral and heavy metal contents in Peach and Grape grown at Some Major Agricultural Companies in Saudi Arabia. Orient J Chem 2013;29(4). Available from: http://www.orientjchem.org/?p=1474 |
Introduction
Currently, extensive use of inorganic fertilizers and integrated insect-pest management approach are being adopted for increased fruit production to meet the higher demands for human consumption andto earn more income from the
progressive farms. The extensive uses of these resources play an important role in increasing the mineral contents of soils and plant tissues.Large quantities of fertilizers are regularly added to soils in intensive farming systems to provide adequate N, P, and K for plant growth. The chemical compounds used to supply these elements contain trace amounts of heavy metals (e.g., Cd and Pb) as impurities, which, after continued fertilizer application may significantly increase their content in the soil[1]. Some heavy metals are needed in trace amounts as Zn, Cu, Mn and Fe for plants[2].
High concentration of these metals in the agriculture ecosystems may lead to an excessive accumulation of metals, which may be toxic to plants and cause possible health problems to animals and human[3]. Contaminated soils represent a real hazard to human health and also limit the area available for agriculture. Turkdogan et al., [4]investigated levels of seven different heavy metals in soil, fruit and vegetable samples of Van region in Eastern Turkey, where upper gastrointestinal cancers are endemic.
The results showed that the levels of Pb, Cd, Ni, Zn, Cu, Mn, and Co were 409, 25, 53, 44, 70, 160, 269 mg/kg, respectively, which were absolutely higher than the legally permissible limits. Krejpcio et al., [5] determined the content of Pb, Cd, Cu and Zn in fresh fruit and juices in the Polish market. It was found that most fruit samples (90.4%) contained low levels of heavy metals. However, the remaining 9.6% contained high concentration ofheavy metal (Pb 2.2%, Cd 4.4%, Cu, 1.5%, Zn 1.5%). Most fruit juice sample (88%) met the national standard criteria, but 12% exceeded the permissible limits (as established by the National Ministry of Health of Poland) for Pb and Cd (3% and 9%, respectively).
Mahdavian and Somashekar[6]studied the level of heavy metals in a number of fresh fruits and results showed that the average levels of Cd, Co, Cr, Cu, Fe, Mn, Ni, Pb, and Zn were 7.05, 40.93, 75.63, 10.87, 167.39, 61.0, 53.87, 53.87, and 30 mg/kg, respectively. Zahir et al., [7]determined levels of majorheavy metals in 10 different varieties of fruits inPakistan, the results were in the range of 7.924-24.674 ug/g Fe, 0.531-7.571 ug/g Pb, 0.013-0.612 ug/g Mn, 0.543-3.234 ug/g Cu, 0.144-5.033 ug/g Ni, 0.173- 0.299 ug/g Cd, 3.268-4.343 ug/g Cr, 0.138-21.409 ug/g Zn, 0.104-1.168 ug/g Co.Furthermore, Pandeyet al.[8]reported that the metal concentration in soil increased from 8.00 to 12.0 mg/ kg for Cd, and for Zn from 278 to 394 mg/ kg.
They also suggested that if the trend of atmospheric deposition is continued, it would lead to a destabilizing effect on sustainable agricultural practice and increase the dietary intake of toxic metals. Human beings are encouraged to consume more fruits, which are a good source of vitamins, minerals, fibers and also beneficial to their health. However, the intake of food contaminated by heavy metals is harmful to human health and several countries have imposed food laws to restrict the presence of heavy metal concentration in food and beverages [9].Mahdavian and Somashekar[6]stated that the presence of heavy metals in human body always draws scientific concern as these are considered responsible for affecting health, especially in these days due to the disposal of toxic wastes in the environment has been increased.
The increasing trends in food contamination in urban areas are largely attributed to the polluted environment in urban agriculture, contaminated food transport and supply chains; poor market sanitary conditions, and the use of contaminated or waste water for irrigation purposes.
Healthy plant growth required not only macronutrients (N, P, K, S, Ca, and Mg), but also essential micronutrients such as Co, Cu, Fe, Mn, Mo, Ni, and Zn [2]. Most of the agricultural soils in Saudi Arabia are bare sand with loworganic matter, as a result of continuous application of large quantities of fertilizers (inorganic fertilizers and livestock manures) to soils in intensive farming systems to provide adequate nutrients for plants growth. Application of livestock manures (e.g., cattle, sheep, poultry etc.) to land leads to the accumulation of heavy metals such as As, Cd, Cr, Cu, Pb, Hg, Ni, Se, Mo, Zn, Tl, Sb in the soil [10]. Although in poultry industry the Cu and Zn added to diets as growth promoters may also have the potential to cause metal contamination of the soil and if repeatedly applied to restricted areas of land, can cause considerable buildup of these metals in the soil in the long run [11, 12 ].
Moreover, in integrated insect-pest management, most of the chemicals that are used extensively in agriculture as insecticides and fungicides were based on compounds which contain Cu, Hg, Mn, Pb, or Zn [1]. Theenvironmental pollution by heavy metals has not yet reached to critical level in the agriculture ecosystem of Saudi Arabia. A great attention should be paid to highlight the real effects of the possible pollutants induced with the industrial capitals on agricultural areas present near the industrial cities. In some parts of Saudi Arabia,
the pollution of the environment with heavy metals has increased dramatically due to the boost in industrial sector [13].A review of literature showed that there is inadequate information available on the mineral composition ofagricultural sector in Saudi Arabia to determine toxic levels of some of the heavy metals in fruits for human consumption.
Therefore, themain objective of this study was to determine the mineral and heavy metals concentration in peach and grapegrowing in three major agricultural companies(A, B, and C) in Saudi Arabiaand compare its concentrations with the established standards of Joint FAO/WHO [14]the provisional tolerable daily intake (PTDI) and the U.S. National Academy of Sciences[15]the tolerable daily upper intake level (UL)for human consumption.
Materials and Methods
Study Location
Three main agricultural companies(A, B, and C) are the major fruit producers in Saudi Arabia, therefore these three sites were selected for this study.
Collection of Samples
Fruitsampleswere collected at the peak of the harvest period during May and July, 2012 from farms of the selected companies.The peak of the harvest period was chosen keeping in mind the fact that the metal concentration in plants changes with age of plants and the growing season.Fruits of the selected fruit trees were randomly picked from three locations, wrapped in brown wrapper and transported to analytical laboratory for procurement by drying and analysis.
Preparation of Samples
Fruit Samples were washed first by tap water followed by the de-ionizedwater, drained properly and shredded before drying. All samples weredried in an air oven at 800C for about 72 hours, then cooled to ambient temperature,milled by means of a Willy Mill and sieved through 1 mm diameter mesh. Theground samples were packedin airtight plastic containersand stored for analysis.Concentrated HNO3 (3ml) was added to a 50ml flask containing approximately 0.5 gground oven-dried plant sample.The flask was swirled gently and the contents digested slowly on an electro-thermal heaterto 1000C for 5 hours.
The temperature of the digestion mixture was raised gently until it reached 100o C. The digest was then cooled and filtered through 541 Whatman filter paper into avolumetric flask and diluted to 50 ml with distilled water. The residual acid concentrationof the digested sample was brought to 1% v/v after digestion.
Analysis of Samples
The digested samples wereanalyzed for trace metals, using Atomic Absorption Spectrophotometer, Model 451[16]. The instrument was calibrated using standard solutions of copper, iron, manganese, zinc, magnesium, Calcium, and cadmium. The absorbencies obtained were used in calculating the concentrations of the metalsin the different samples.
Statistical analysis
Fruits sample were assayed and analyzed individually in triplicate. One way analysis of variance (ANOVA) was used to determine significant difference, considering a level of significance of less than 5% (p<0.05) by using SAS User’s Guide [17].
Mineral Concentrations in Fruits of Different Companies:
The mineral concentrations (Cu, Fe,Mn, Zn, Mg, Ca, and Cd) of peach and grape fruits grown at different companies are summarized in Table 1 and 2. All the minerals concentration is presented as mg/kg.
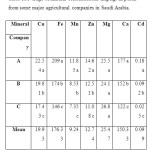 |
Table 1.Average of mineral concentrations (mg/kg) in peach from some major agricultural companies in Saudi Arabia. Click here to View table |
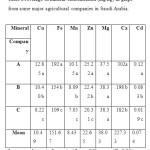 |
Table 2.Average of mineral concentration (mg/kg) in grape from some major agricultural companies in Saudi Arabia. Click here to View table |
Copper (Cu): Mean concentration of Cu inpeach and grape in different companies ranged from 17.4- 22.54 and 8.22-12.85 mg/kg, respectively. Results showed that Cu concentrations in both fruits differsignificantly at 0.05 level of significance and the highest concentrations in both fruits were observed in A Company as compared to others. Researchers from different countries in the world have been determined Cu concentrations in different kinds of fruits[4, 5, 7,18- 21]. While emphasizing the Cu concentrations of peach and grape, it was found that Radwan and Salama[22] have been reported a mean Cu concentration of 1.46mg/kg in peach samples collected from Egyptian markets. Tormen et al.[23] determined a mean Cu concentration of 150μg/L in peach juice samples collected from Brazilin markets. Acar[24]found that the Cu concentrations of peach juice and peach nectar sampled from different supermarketsin Ankara, Turkey were 5.87 and 5.62 mg/kg, respectively. Sobukola et al.[25]also reported a mean Cu concentration of 0.003mg/kg in grape samples collected from selected markets in Lagos, Nigeria.
Bagdatlioglu et al.[26] determined a mean Cu concentration of 0.51mg/kg in grape samples grown in Manisa region, Turkey. Moreover, Elbagermi et al.[27] reported mean Cu concentrations of 1.87 in peach and 2.13mg/kg in grape samplesof Misurata area in Libya. However, the Cu concentrations of peach and grape observed in aforementioned studies were much lower than that observed in the present study (Table 3), Moreover; the concentration levels of Cu were higher than the permissible limits according to the Joint FAO/WHO and the U.S. National Academy of Sciences (Table 4). The Cu concentrations of peach in all companies were two times more than the tolerable daily upper intake levels according to the U.S. National Academy of Sciences, while the concentrationswere seven times more than the prescribed limits of the Joint FAO/WHO. Average concentration of Cu in the peach and grape from A Company was higher than the tolerable daily intake and the dietary reference intake, and this might be due to the application of micronutrient fertilizers and the widespread use of copper compound as a pesticide or fungicide.
Also maybe as a result ofapplication of poultry (chickens and quails) manures since A Company isone of the biggest poultry producers in Saudi Arabia, and in poultry industry the Cu and Zn are added to diets as growth promoters [11,12].
Iron (Fe): Among the investigated minerals, Fe showed the highest concentration in both fruits. The levels of Fe ranged from 146 to 209 mg/kg in peach and 109 to 192 mg/kg in grape. The highest concentrations of Fe in both fruits were in A Company which was different significantly at 0.05 level of significance. From the results, it can be noted that the levels of Fe obtained in this study were muchhigher than those reported byBagdatlioglu et al., [26], Tormen et al. [23] and Acar [24], and were inagreement with Mahdavian and Somashekar[6] for similar fruits(Table 3).
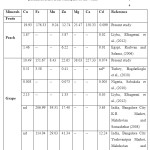 |
Table 3. Levels of metals (mg/kg) in fruits in previously published results from other parts of the world. Click here to View table |
The concentrations of Fe in both fruits at all companies were two to four times higher than the permissible limits according to the Joint FAO/WHO and the U.S. National Academy of Sciences (Table 4), that probablycould be referred to the excessive usage of inorganic fertilizers and livestock manures (e.g., cattle, sheep, poultry etc..) which areregularly added to soils in intensive farming systems to meet the higher demands of fruits production for Saudi markets.
Manganese (Mn): Analyses of peach sample showed the lowest concentration of Mnin B Company as 7.35 mg/kg, while the highest was 11.85 mg/kg in A Company which was significantly different as compared to other companies. Results of Mn concentrations of the present study were higher than the study of Tormen et al.[23] who found a 120μg/L of Mn in peach juice samples collected from Brazilin markets. On the other hand, mean concentrations of Mn in grape sample ranged from 7.05 – 10.15 mg/kg and the highest concentration of Mnwas found in A Company. Mahdavian and Somashekar[6] studied the level of heavy metals in fresh fruit samples collected from the two main Bangalore City Markets in India.They found the concentrations of Mn in grape sample ranged from 29.03 – 39.31 mg/kg which were higher than the results of the present study(Table 3).
The concentrations of Mn in both fruits of B and C companies were within the permissible limits, whereas in A Company concentrations of Mn in both fruits were slightly higher than the WHO recommended 2–9 mg per day for an adult [28] and the tolerable daily upper intake levels according to the U.S. National Academy of Sciences (Table 4).
Zinc (Zn): The mean Zn concentration of peach and grape in different companies ranged from 11.08- 14.62 and 20.31- 25.22 mg/kg, respectively. The data showed that peach and grape in different company were different significantly in Zn concentration at 0.05 level of significance. Also, the highest Zn concentrations in both fruits were in Acompany than others. Studies from different countries around the world have determined Zn concentrations of peach and grape, Radwan and Salama[22] have reported a mean Zn concentration of 6.22mg/kg in peach samples collected from Egyptian markets. Tormen et al.[23] determined a mean Zn concentration of 180μg/L in peach juice samples collected fromBrazilin markets. Acar [24] found that the Zn concentrations of peach juice and peach nectar sampled from different supermarketsin Ankara, Turkey were 0.61 and 0.49 mg/kg, respectively.
Sobukola et al. [25] also reported a mean Zn concentration of 0.073mg/kg in grape samples collected from selected markets in Lagos, Nigeria. Bagdatlioglu et al.[26] determined a mean Zn concentration of 0.41mg/kg in grape samples grown in Manisa region, Turkey. Moreover, Elbagermi et al.[27] reported mean Zn concentrations of 5.87 in peach and 1.33mg/kg in grape samplesof Misurata area in Libya. However, the Zn concentrations of peach and grape observed in above mentioned studies were lower than that observed in the present study (Table 3), Moreover; Mahdavian and Somashekar[6] studied the level of heavy metals in fresh fruit samples collected from the two main Bangalore City Markets in India. They found the average concentration of Zn in grape sample as 30 mg/kg which was higher than the results of the present study(Table 3). The concentration levels of Zn in both fruits were within the permissible limits according to the Joint FAO/WHO and the U.S. National Academy of Sciences (Table 4).
Magnesium (Mg): Magnesium concentration ranged from 24.1-26.8 mg/kg in peach and 37.5- 38.8 mg/kg in grape in different companies. Data showed that the Mg concentration in both fruits did not differ significantly at 0.05 level of significance, and was within the permissible limits according to the U.S. National Academy of Sciences (Table 4).
Calcium (Ca): MeanCa concentration ranged from 122- 177 mg/kg in peach and 182- 302 mg/kg in grape in different companies. Data showed that the Ca concentration in both fruits were significantly different at 0.05 level of significance. The highest Ca concentration in both fruits was in A Company as compared to others, and was within the permissible limits according to the U.S. National Academy of Sciences (Table 4).
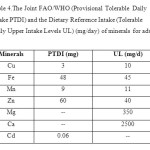 |
Table 4.The Joint FAO/WHO (Provisional Tolerable Daily Intake PTDI) and the Dietary Reference Intake (Tolerable Daily Upper Intake Levels UL) (mg/day) of minerals for adults. Click here to View table |
Cadmium (Cd): Mean Cd concentration of peach and grape in different companies ranged from 0.025- 0.18 and 0.019- 0.12 mg/kg, respectively. Theresults showed that peach and grape in different companies differedsignificantly in Cd concentration at 0.05 level of significance. Also, the highest Cd concentration in both fruits wasin A Company than others. There are many reports onCd concentrations of peach and grape from different countries around the world. It was found that Radwan and Salama [22] have reported a mean Cd concentration of 0.015mg/kg in peach samples collected from Egyptian markets. Tormen et al.[23] determined a mean Cd concentration of 0.45μg/L in peach juice samples collected from Brazilin markets. Sobukola et al.
[25] also reported a mean Cd concentration of 0.003mg/kg in grape samples collected from selected markets in Lagos, Nigeria. However, the Cdconcentrations of peach and grape observed in aforementioned studies were lower than that observed in the present study (Table 3). Moreover, Elbagermi et al.[27] reported mean Cd concentrations of 0.02 in peach and 0.05mg/kg in grape samplesof Misurata area in Libya and their results were in agreement with the results of the present study for B Company. Furthermore; Mahdavian and Somashekar [6] studied the level of heavy metals in fresh fruit samples collected from the two main Bangalore City Markets in Indiaand they found the average concentration of Cd in grape sample was 7.05 mg/kg and washigher than the present study results(Table 3).
The concentrations of Cd in both fruits of C Company were within the permissible limits, whereas in BCompany were slightly higher than the permissible limits, but in A company Cd concentrations were two to three times higher than the permissible limits according to the Joint FAO/WHO (Table 4).The high concentrations of Cd found in peach and grape samples of A and B Companies probablymay be attributedto the excessive usage of fertilizers especially phosphoric fertilizers where Cd is found predominantly in phosphoric fertilizers [29].
Table 4 represents the provisional tolerable daily intake (PTDI) of toxic metal and the tolerable daily upper intake level (UL) of essential minerals. Average concentration of (Cu, Fe, and Cd) in the peach and grape from A and BCompanies were higher than tolerable daily intake and the dietary reference intake which may pose a health risk to daily consumer and the long term consumption of these fruits should be of concern for the accumulation of the toxic metals especially cadmium in target organs such as kidney and liver [30]. The average concentrations of the essential metals (Mn, Zn, Mg, and Ca) were lower than the dietary reference intake. However, at the same time, these fruits can serve as a good source of essential metals (Mn and Zn) for humans.
Conclusions
The study showed that the consumers are at greater risk of purchasing fresh peach and grape from A and BCompanies with high levels of heavy metals above the legally permissible limits as defined by the Joint FAO/WHO and the U.S. National Academy of Sciences. Moreover, from the results it was clearly seen that there is a lot of potential for further research in evaluating the mineral composition of fruits to mitigate health and environmental hazards likely to be occurred due to the consumption of contaminated fruit especially with heavy metal ions.
References
- Jones L.H.P., Jarvis S.C. The fate of heavy metals, in The Chemistry of Soil Processes, Green, D. J., and Hayes, M. H. B. Eds., JohnWiley& Sons, New York, NY, USA,p. 593 (1981).
- Marschner H. Mineral Nutrition of Higher Plants, 3rd Ed. London: Academic Press: 889 (2012).
- Suruchi, Khanna P. Research Journal of Environmental Toxicology. 5,162-179(2011).
- Turkdogan M.K., KilicelF., KaraK., TuncerI., UyganI. Environmental Toxicology and Pharmacology. 13, 175-179(2002).
- Krejpcio1 Z., SionkowskiS., BartelaJ. Polish Journal of Environmental Studies. 14 (6), 877-881 (2005).
- Mahdavian S. E., SomashekarR.K. Kathmandu University Journal of Science, Engineering and Technology. I (V), 17-27 (2008).
- Zahir E., NaqviI.I., MohiUddinS. Journal of Basic and Applied Sciences. 5 (2), 47-52(2009).
- Pandey A.K., Pandey S.D., Misra V. Ecotoxicol. Environ. Safety. 47, 195-200(2000).
- Seenivasan S., Manikandan N., Muraleedharan N.N., Selvasundaram R. Food Control. 19, 746–749(2008).
- Basta N. T., Ryan J. A., Chaney R. L. Journal of Environmental Quality. 34(1), 49–63(2005).
- Chaney R. L., Oliver D. P. Sources, potential adverse effects and remediation of agricultural soil contaminants. in Contaminants and the Soil Environments in the Australia- Pacific Region, R. Naidu, Ed., Kluwer Academic Publishers, Dordrecht, The Netherlands.pp. 323–359(1996).
- Sumner M. E. Communications in Soil Science and Plant Analysis. 31(11–14), 1701–1715(2000).
- Al-Khateeb, S.A, LeilahA.A. J. of Biological Sciences. 5 (6), 707-712(2005).
- JOINT FAO/WHO FOOD STANDARDS PROGRAMME CODEX COMMITTEE ON CONTAMINANTS IN FOODS. Fifth Session, The Hague, the Netherlands, 21 – 25 March (2011).
- Otten J.J., Hellwig J.P., Meyers, L.D. Dietary Reference Intakes: The Essential Guide to Nutrient Requirements. National Research Council. The National Academies Press, Washington, DC.(2006).
- A.O.A.C. Official Methods of Analysis. 14th Ed. Association of Official Analytical Chemists, Arlington, U.S.A.(1984).
- SAS User’s Guide. Statitistical Analysis System Institute for Windows, SAS user’s guide: Statistics. Version 8.0 e. SAS Inst., Inc., Cary, North Carolina.(2001).
- Jalbani N., AhmedF., kaziT.G., RashidU., MunshiA.B., KandhroA. Food and Chemical Toxicology. 48, 2737–2740(2010).
- Banerjee D., Kuila P., Ganguly A., Ray L.EJEAFChe. 9 (7), 1190–1195(2010).
- Hamurcu M, OzcanM.M., DursunN., GezginS. Food and Chemical Toxicology. 48, 1767–1770(2010).
- Ali M. H.H, Al-QahtaniK.M. Egyptian Journal of Aquatic Research 38, 31–37(2012).
- Radwan M.A., Salama A.K.Food ChemToxicol. 44, 1273–1278(2006).
- Tormen L, TorresD.P., DittertI.M., AraujoR.G.O., FrescuraV.L.A., CurtiusA.J. Journal of Food Composition and Analysis. 24, 95 –102(2011).
- Acar O. Eurasian J Anal Chem. 6(2), 114-128(2011).
- Sobukola O. P., AdeniranO.M., OdedairoA.A.,KajihausaO. E.African Journal of Food Science. 4(2), 389 – 393(2010).
- Bagdatlioglu N, NergizC., ErgonulP.G. Journal of Consumer Protection and Food Safety. 5, 421–428(2010).
- Elbagermi M.A., EdwardsH.G.M., AlajtalA.I. International Scholarly Research Network. ISRN Analytical Chemistry.1- 5(2012).
- WHO (World Health Organization). Quality Directive of Potable Water, WHO, Geneva, 2nd Edition. p. 197, (1994)
- Demirezen D., Aksoy A. J Food Qual. 29, 252–265(2006).
- Divrikli U., Saracoglu S., Soylak M., Elci L. Fresenius Environ. Bull. 12, 1123-1125(2003).

This work is licensed under a Creative Commons Attribution 4.0 International License.
![]()
A New Edition of Web of Science
Journal Impact Factor
2022: 0.5
Five Year: 0.8
Journal is Indexed in

Cabells Whitelist
![]()


