Study of carbon foams synthesized by the pyrolysis of wastes coconut shells of african palm at different conditions and use of immersion calorimetry as a tool for characterization
Juan Carlos Moreno-Piraján1, Liliana Giraldo2
1Grupo de Investigación en Sólidos Porosos y Calorimetría, Departamento de Química, Universidad de los Andes. Carrera 1 No 18 A 10, Bogotá/Colombia. 2Facultad de Ciencias, Departamento de Química, Universidad Nacional de Colombia. Carrera 30 No 45-03, Bogotá/Colombia
DOI : http://dx.doi.org/10.13005/ojc/290305
Article Received on :
Article Accepted on :
Article Published : 28 Oct 2013
In this research, we are analysing the behaviour of the wastes coconut shells of african palm (Elaeis guineensis) when dealing with different gas mixtures and its influence on the development of lattice porous internal and its formation as foam. The study shows that samples worked with water vapour mixtures developed the highest percentage of carbon foam as foams. The greatest expansion of the material occurred when 300 g of precursor, in the presence of steam at a pressure of 2.0 MPa, was introduced into a 1000 mL stainless steel reactor placed inside a sand-bath furnace previously heated to 550 °C. A relationship between the heating rate and degree of foaming was observed with the synthesized materials. An interesting result of this work was the relation established between yield and degree of foaming and between degree of foaming and immersion enthalpy.
KEYWORDS:immersion enthalpy;foam carbon;degree foaming;wastes coconut shells of african palm;Elaeis guineensis
Download this article as:| Copy the following to cite this article: Moreno-Piraján J. C, Giraldo L. Study of carbon foams synthesized by the pyrolysis of wastes coconut shells of african palm at different conditions and use of immersion calorimetry as a tool for characterization. Orient J Chem 2013;29(3) |
| Copy the following to cite this URL: Moreno-Piraján J. C, Giraldo L. Study of carbon foams synthesized by the pyrolysis of wastes coconut shells of african palm at different conditions and use of immersion calorimetry as a tool for characterization. Orient J Chem 2013;29(3). Available from: http://www.orientjchem.org/?p=264 |
INTRODUCTION
The special structures of carbon foams, whose characteristics give them a special value and a wide range of applicability, have recently been synthesized. They have a microstructure in the defined structure and other properties include thermal conductivity and high rigidity1-3. Such properties make them materials that may have applications where these features are very important, for example in insulating materials and as structural materials. Additionally, carbon foam with features suitable for aircraft and ships has recently been developed4-7.
Carbon foams may have a greater range of applications according to the synthesis conditions: for example, according to the temperature and pressure taken to start the material. As a result, the foam may have higher grade management during the process of graphitization and so it can be used to replace the panels built in aluminium panels, in many tools and noise insulation systems and in fuel storage, the latter being one of the more promising applications8-13. These two variables (pressure and temperature) also determine several final foams, not just the textural characteristics but also the topology and distribution of the material on the edges of the cells and faces14.
During thermal treatment of the starting materials, the composition of the precursor changed where the fixed carbon content changed and products of the decomposition of the reaction were generated. During this reaction, gases are produced that begin to generate large hollow structures inside the carbonized material11-13. Studies on the pyrolysis of cellulosic and lignocellulosic materials indicate that the largest transformations take place in the 200–400 °C temperature range, these being accompanied by a fast evolution of gases and the enhancement of the solid’s temperature. As the particles of the precursor shrink, it is assumed that the decomposition products of the constituting polymers (mainly cellulose, hemicellulose and lignin) react to form a series of linked chemical bonds and the solid, which becomes richer in carbon, progressively becomes rigid11-14. The evolved gases leave the solid through the channels present in the structure of the vegetal matter, thus enabling the shrinkage of particles and the maintenance of the precursor’s appearance7,13. Consequently, the formation of carbon foam by pyrolysis of these precursors is not common and it has not being reported previously. Publications related to the preparation of carbon foams from lignocellulosic and cellulosic materials are not abundant, and some authors12-14 have reported, for example, a dilatation of 20% rather than a contraction during pyrolysis of almond shells pre-treated at 300 °C. Similarly, expansion of the particles after the pyrolysis of sawdust from bleached cedar wood is described13,14.
Various techniques have been used for the study of these materials. However, few studies report on the thermodynamics and an approach to this study can be carried out by immersion microcalorimetry. Immersion calorimetry is used to ascertain, according to the system’s thermodynamic conditions, the heat that is produced when a solid and a liquid come into contact, tantamount to the immersion enthalpy of the contact process, which is established for a specific quantity of the solid being studied. The resultant thermal effects of immersing a solid in a solvent, generally of the non-polar type, with which the solid does not present chemical interactions, can relate to the surface properties of the solid considered.15-17
Alternative determinations of immersion enthalpy can be undertaken in isothermal calorimeters that have a small thermal resistance, RT, and high surrounding heat capacity. Thus, the heat flow is generally due to the small difference in the given temperature between the surroundings, TS, and the cell, TC, during the occurrence of the observed process18, so the heat quantity can be evaluated from temperature records, or as a property proportional to the following as a function of time.

In many cases the calibration factor K, can be registered as constant in the range of temperature in which the studied process is carried out19.
Once the immersion enthalpy of the solid is known, which for this work is the activated carbon, the enthalpy relates to the volume of the micropore, Wo, and the molar volume, Vm, of the adsorbent by means the Stoeckli and Kraehenbuehl equation20:
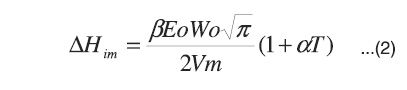
This shows that the immersion enthalpy, ΔHim, corresponds to the process of filling the micropores and it is different from the wetting enthalpy of open or non-porous surfaces. The experimental immersion enthalpy, ΔHexp, of the activated carbons has two types of contribution: one due to the micropores and the other to the external surface wetting, Sext, such as raised by Stoeckli, Bansal and Donnet21. This can be expressed by means of the following equation:

The immersion enthalpy is a characterization parameter that will be different insofar as the physical and chemical characteristics of the solids vary
This paper analyses the pyrolysis conditions necessary for expanding a lignocellulosic material such as pine cones, in order to obtain carbon foam. The process involves the transformation of precursor grains in continuous block. The experimental procedure followed was similar to those reported by the literatura14, in order to make comparisons with the results obtained in this work. Also, the plus of this investigation was the use of immersion calorimetry to determine possible relationships between synthetic materials and immersion enthalpies.
EXPERIMENTAL DETAILS
Thermal treatment and synthesis of carbon foams
The precursor, wastes coconut shells of african palm (Elaeis guineensis), ground to a uniform particle size (4.5 mm), is loaded into a glass tube (80 mm internal diameter) which is introduced into a 1000 mL stainless steel reactor placed inside a sand-bath furnace previously heated to 570 °C. The temperature is controlled at the inlet and outlet of the reactor for defects. The temperature of the gases evolves during pyrolysis using two K-type thermocouples. The system can operate at pressures as high as 2.5 MPa, and controlled depressurization is possible. A schema of the system has already been published by other authors9,13.
The equipment used here was designed and built in our laboratory and its schema is shown in Figure 1. Its construction, as mentioned, was based on reports in the literature and adapted to the elements we had in our laboratory.
The equipment has tubes that are placed within the reactor, which is within the sand bath (to ensure a maximum uniformity of temperature). When pyrolysis occurred it was carried out under an atmosphere of nitrogen (99.999 vol.%), the nitrogen also being used to establish pressures in the system. When operating at one pressure of 2.3 MPa, the system was depressurized at the reaction temperature at the end of each experiment and then cooled down to room temperature. In other experiments, a combination of high- and low-pressure treatments (depressurization) was carried out. Pyrolysis of the feedstock was carried out in a small laboratory pilot plant. Special features of this system include a maximum sample capacity of 1500 cm3 and an ability to work in the pressure range of 0.1 to 10 MPa. Heating of the reaction tube occurred in a preheated fluidized sand-bath furnace, with a temperature control of ± 0.5°C at 50 °C and of ±1 °C at 600 °C. Heating rates were constant at ≈10 °C min-1 13.
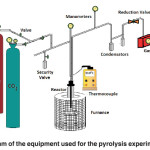 |
Fig. 1: Flow diagram of the equipment used for the pyrolysis experiments in this work.: Click here to View figure |
Table 1 presents the conditions selected for the pyrolysis used in this work, similar to those used in the literature by others authors for comparison13. As an example, Experiment 1 has been carried out as follows: the glass tube charged with 300 g of the precursor is introduced at room temperature.
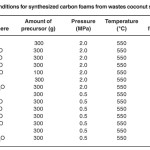 |
Table 1: Pyrolysis conditions for synthesized carbon foams from wastes coconut shells of african palm. Click here to View table |
Next, the reactor is filled with nitrogen at 2.0 MPa and introduced into the sand-bath furnace where it is externally heated. Pressure is kept constant inside the reactor during the experiment as the gas outlet has a pressure control valve. When the temperature of the solid reaches 550 °C, the furnace is removed and the reactor is depressurized. In the majority of the experiments (see column 2 in Table 1), 50 mL of water were incorporated into the reactor, around the glass tube, in order to generate a steam-rich atmosphere before the beginning of the pyrolysis. Each of the experiments was varied and the gas mixture was maintained at the working pressure of 1–7 and then the experiment undertaken with the same pressure change mixtures of 2.0 MPa to 0.5 MPa.
Material characterization
Nitrogen adsorption-desorption isotherms were measured at -196 °C using an IQ2 Quantachrome Inc. (Boynton Beach, USA) volumetric adsorption analyser. Before the measurements, samples were outgassed for 3 h at 250 °C in the degas port of the adsorption analyser. The BET specific area22-24 was calculated from the adsorption data in the relative pressure range from 0.04 to 0.45 using the nitrogen atom cross-section area of 0.162 nm2. The total pore volume 10 was assessed from the amount adsorbed at a relative pressure of about (P/Po) 0.995 assuming that the density of nitrogen condensed in the pores is equal to that of liquid nitrogen at -196 °C (1.2506 g.cm3). The mesopore volume22-25were calculated using αs analysis. In the αs-plot method, the amount adsorbed for a solid under study is the amount adsorbed for a solid under study is plotted as a function of the standard reduced adsorption αs for the reference solid (αs is defined as the amount adsorbed on the reference adsorbent divided by the amount adsorbed on it at a relative pressure of 0.4). A high-pressure linear part of the αs-plot (αs between 1.2 and 1.8, i.e., relative pressure from 0.6 to 0.87) was used to calculate Sext from the slope of the line and to obtain Vp from its intercept with the “Amount Adsorbed” axis. The total pore volume Vt was assessed from the volume of nitrogen adsorbed at a relative pressure P/Po of 0.99 by converting it to the volume of liquid nitrogen at 77 K22-25.
Pore size distributions were calculated from adsorption branches of the isotherms using the BJH method with the experimental statistical film thickness curve and the modified Kelvin equation for nitrogen adsorption in cylindrical pores 23-25.
pH at the point of zero charge
The pH of the point of zero charge pHPZC, that is, the pH above which the total surface of the carbon particles is negatively charged26-28, was measured by the so-called pH drift method26,28. For this purpose, 50 cm of a 0.01 M NaCl solution was placed in a jacketed titration vessel, thermostatted at 25 °C, and N was bubbled through the solution to stabilize the pH by preventing the dissolution of CO. The pH was then adjusted to successive initial values between 2 and 12, by adding either HCl or NaOH and the activated carbon (0.15 g) was added to the solution. The final pH, reached after 48 h, was measured and plotted against the initial pH, as illustrated in Figure 1. The pH at which the curve crosses the line pH(final) = pH(initial) is taken as the pHPZC of the given carbon foams28.
For the chars obtained mainly in granular form (1, 2 and 3), the average particle diameter has been determined using a photographic system, and by counting and sizing a representative amount of particles. The bulk density of granular chars has also been determined by weighting a calibrated volume filled with the char (method ASTM D 2854-89).
Experimental of immersion calorimetry
In the present work, experimental immersion enthalpies of the synthesized carbon foams in benzene (with respect to mass) were determined, to estimate the energetic interactions that occur when the solids are in contact. Figure 2 shows the equipment used for these measurements. A conduction microcalorimeter, equipped with a calorimetric cell made of stainless steel, was used for determination of the experimental immersion enthalpies29-33. Prior to the experiment, the sample was outgassed under vacuum (10-3 Pa) at 250 °C for 4 h in a glass bulb. The bulb was then sealed in a vacuum and inserted into a calorimetric chamber containing the immersion liquid. Once thermal equilibration was reached, the brittle end of the glass bulb was broken and the heat released was followed over time. A detailed description of the experimental setup can be found elsewhere29-31. Approximately 8 mL of each solvent (previously kept at 298 K in a thermostat) was placed inside the cell. Between 50 and 800 mg of mesoporous solid samples were put in a glass bulb at a point inside the calorimetric cell, and the microcalorimeter was assembled. When the device reached a temperature of 25 °C, the output potential was recorded for approximately 15 minutes, with data points recorded every 20 seconds. After 15 minutes, the glass bulb broke, and the resulting thermal effect was recorded, while potential readings were taken for an additional 15 minutes. Finally, the device was electrically calibrated.
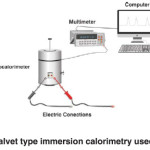 |
Fig. 2: Tian-Calvet type immersion calorimetry used in this work. Click here to View figure |
RESULTS AND DISCUSSION
Experimental conditions that lead to the formation of carbon foam
Figure 3 shows the variation in the temperature for both the solid and gas outlets of the furnace during the pyrolysis for Experiments 1 and 7 of Table 1. The initial temperature of the furnace, 550 °C, slightly decreases when it comes into contact with the reactor, which is originally at room temperature. Since the reactor mass is rather high with respect to that of the precursor, the temperature profile of the furnace for all experiments is very similar. This phenomenon is in agreement with the results of Rios et al. and Santamaría-Ramírez et.al13,14.
Analysing the results of the temperature of the inlet and outlet gases, the solids mixture for each behaviour is observed and, in particular, mix 7, for example, corresponding to CO2 + H2O, shows that the temperature rises rapidly from 7 min to between 120 and 160 °C and then the gas temperature stabilizes between the temperature range of 280 and 470 °C. One can see in the profile of these gases that the temperature increases at a similar time to the same solid and then stabilizes at a temperature slightly lower: between 250 and 430 °C. It is most likely that in the period of 7–10 min at a temperature of 470 °C large pores will be generated and the carbonaceous foam network itself constructed under these experimental conditions, this being that the mixture achieves higher porosity in the foam and textural area. This is interesting because this is a mixture which is more economical compared to the others when considering obtaining industrial scale foams. Here, undoubtedly properties of the two molecules play an important role in the development of porosity because they have a large diameter compared to those of most blends. Furthermore, Figure 3 shows the temperature profiles of Sample 1, which uses only N2 and the respective solid. This gas increases the temperature at around 12 minutes and does so more damped and not as rapidly as in the previous case. The solid has a slightly lower temperature profile and stabilizes after 40 minutes to 270 °C. Similar results were obtained with the other mixtures (not shown here) which show that the temperature profile of the solid is an important variable in the development of the degree of foaming of the carbon material. When analysing the results reported in Table 1, it is clear that if the pressure within the system is decreased, the degree of foaming decreases dramatically, which makes sense considering that this variable allows the gas to be increased leaving larger structures within the carbonaceous system network
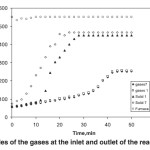 |
Fig. 3: Temperature profiles of the gases at the inlet and outlet of the reactor for Samples 1 and 7. Click here to View figure |
Experiments 1–7 show that the pressure was kept constant at 2.0 MPa in order to assess the effect of change in the mixture of the pyrolysis gases on the degree of foaming and the developed yield. The degree of foaming ranged from 8–89% when only nitrogen atmosphere and then a mixture of CO2-H2O, respectively, were used. This shows that using an N2 atmosphere only the optimal development of carbonaceous foam fails at 2.0 MPa and that a mixture of CO2-H2O enables high pore development corresponding to a foam. The yield in these experiments, as shown in Table 1, varied between 43 and 73% which is a very good performance and comparable to those obtained using other materials reported in the literature13,14. The shape of the temperature profiles, reported in Figure 3, shows the importance of recording this variable in relation to the formation of carbon foams and indeed the experimental difficulty in establishing such profiles. However, the profiles reported in this paper are a good approximation of what happens during the process of generating foam considering the controls used to measure the temperatures of each of the elements.
According to studies of the temperature profiles of each of the mixtures used for carbon foams, studies at high pressures and gas mixtures with large molecule temperatures are favoured. In thinking about the mechanism of foam formation, which has already been raised by several authors, it is clear that the proposed formation mechanism is the same considering that our starting material is a lignocellulosic material, whereas the literature mentions that, during the pyrolysis process and owing to its composition, there is a softening of the production as an intermediate matrix and, subsequently, gases are generated as a product of combustion and the gas mixture in each case, and various reactions occur at the exit of the structure generating a carbonaceous foam.
Results of the nitrogen isotherms at -196 °C
The isotherms obtained in this work are type IV according to the classification of the IUPAC (not shown here), which has a nitrogen adsorption at low pressure with a small amount of nitrogen adsorbed, and all samples appear in a loop of marked hysteresis characteristic mesoporous samples and particularly in carbon foams.
Table 2 shows the results obtained for each of the samples under the experimental conditions reported in Table 1
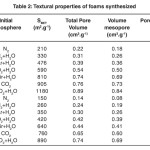 |
Table 2: Textural properties of foams synthesized. Click here to View table |
The results show that the textural properties of each of the foams synthesized in this work are a function of the variables, synthesis pressure and composition of the mixture of gases used for the respective samples, which is in good agreement with the results reported in the literature. It can be seen in the results reported in Table 2 that, when the foams are obtained by using only N2 gas to generate the foam structure, lower carbonaceous values of the area (210 and 150 m2.g-1, respectively) arise. However, when used in mixtures of water vapour, BET area values start to increase until reaching a peak value of 1180 m2.g-1 when using a mixture of CO2+H2O. Water vapour, according to these results, shows that it is a gas and determining the textural properties affects synthesized carbon foams as shown in Table 2 for the values of total pore volume, mesopore volume and pore diameter.
The pHPZC behaviour is interesting: the foams obtained with N2 have a pHPZC of 8.6 which goes to a slightly lower pH when combined with other gases, such as water vapour. This can be explained if one considers the different mixtures studied with the oxygenated groups added. The same behaviour occurred when the experiments were carried out at a lower pressure. However, pHPZC values do not change, as dramatically under these conditions, which proves that in this type of synthesis, pressure is a very important variable.
Immersion calorimetry analysis
Figure 4 shows a typical thermogram obtained with a Tian- Calvet type heat conduction calorimeter as used in this work.
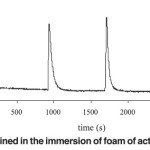 |
Fig. 4: Calorimetric response obtained in the immersion of foam of activated carbon from experiment 10. Click here to View figure |
The first peak corresponds to the heat generated by the contact of the porous solids with the respective immersion liquid and the second corresponds to the electrical calibration when an electrical work during a measured time is supplied. For a relation between the areas under the peaks it is possible to determine the value of the solid immersion enthalpy15.
The heat from immersion in benzene generally shows that the higher degrees of foaming increase these synthetic materials (see Table 2 only for Samples 1–7). This is associated with the number of pores, which were generated, and the diffusion of benzene into the respective porous structures. Enthalpy values are between -95.3 and -184.6 J / g. As we have shown in previous work published by our working group, the calorimetric technique turns out to be a highly sensitive technique for studying this type of porous solid and they can establish certain relationships. This result is another value-added and, again, in our research.
Figure 5 shows the behaviour function immersion enthalpies of foams synthesized in this work from wastes coconut shells of african palm. It is observed that with higher enthalpy values are presented in foams with the development of higher surface area, which corresponds to those obtained from mixtures where there is the presence of water vapour.
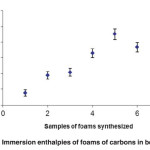 |
Fig. 5: Immersion enthalpies of foams of carbons in benzene Click here to View figure |
This is in agreement with the findings in our study, where the use of steam under pressure generated carbon foams and additionally large surface areas in good agreement with the textural properties.
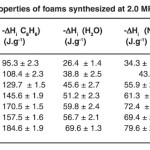 |
Table 3: Textural properties of foams synthesized at 2.0 MPa, for Samples 1–7. Click here to View table |
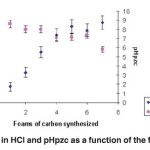 |
Fig. 6: Immersion enthalpies in HCl and pHpzc as a function of the foams synthesized at 2.0 MPa. Click here to View figure |
Furthermore, Figure 6 shows the behaviour of the immersion enthalpies in HCl (0.1M), the pHPZC based carbon foams synthesized to 2.0 MPa. It is observed that the acid enthalpy values increased almost linearly when the mixture was changing from synthesized gas foams, which shows that the water vapour oxidizes the chemical structure of the foam generated inside oxygenated acidic groups, as seen in the results in Table 3. To a lesser extent, core group development is also generated. Furthermore, pHPZC values decrease compared to the change in the gas mixture and this is in good agreement with the previous paragraph. Since the generation of a higher amount of acid groups affects the pHPZC, it is observed that the values decrease towards the acid values .
Conclusions
The formation of carbon foam along the pyrolysis of wastes coconut shells of african palm is facilitated when a reactor containing 200–300 g of precursor under 2.0 MPa of inert gas and steam is introduced into a furnace heated at 550 °C.
The results show that the formation of the carbon foams is strongly dependent on the pressure obtained and the gas mixture used for synthesis.
This study showed that the textural properties of the obtained synthesized foams present a high foaming percentage and high performance, in addition to generating mesoporosity and pore volumes between 0.14 to 89 cm3 and pore diameter between 2.0 to 7.0 nm.
The studies of immersion calorimetry differ with different probe molecules making it possible to verify interesting correlations of the carbon foams prepared in this work
Acknowledgements
The authors would like to thank the Department of Chemistry at the Universidad Nacional de Colombia and Universidad de Los Andes (Colombia) and the Master Agreement established between these two institutions. Special thanks to the Vice-rectoría de Investigaciones de la Universidad de los Andes and the Faculty of Sciences at the same University for its financing of this research.
References
- S. Sihn and A.K. Roy; Modeling and prediction of bulk properties of open-cell carbon foam; J. Mech. Phys. Solids. 23: 167–173 (2004).
- D.K. Rogers, J. Plucinski, P.G. Stansberry, A.H. Stiller and J.W. Zondlo; Low-cost carbon foams for thermal protection and reinforcement applications. In: Proceedings of the 45th International SAMPE Symposium & Exhibition, Long Beach, CA, May 21–25, 2000.
- P.M. Ajayan; Nanotubes from carbon; Chem. Rev. 99: 1787–1792 (1999).
- S. Sihn and B.P. Rice; Sandwich construction with carbon foam core materials; J. Compos. Mater. 37: 1319–1324 (2003).
- M. Kırca, A. Gülb, E.Ekincic, F. Yardımc and A. Mugana; Computational modeling of micro-cellular carbon foams; Finite Elements in Analysis and Design. 44: 45–53 (2007).
- F. Rodríguez-Reinoso; Production and application of activated carbons. In: Schuth F., Sing K.S.W., Weitkamp J., Editors. Handbook of porous solids, vol. 3. Weinheim: Wiley-VCH; 2002. p. 1766–827.
- P. Ehrburger, J. Lahaye and E. Wozniak; Effect of carbonization on the porosity of beachwood; Carbon. 20: 433-442 (1982).
- D.M. Spradling and R.A. Guth; Carbons foams; Adv Mater Process. 161: 161–170 (2003).
- J.W. Klett, A.D. McMillan, N.C. Gallego, T.D. Burchell and C.A.Walls; Effects of heat treatment conditions on the thermal properties of mesophase pitch-derived graphitic foams; Carbon; 42: 1849–1858 (2004).
- J. Klett, R. Hardy, E. Romine, C. Walls and T. Burchell; High-thermal-conductivity, mesophase-pitch-derived carbon foams: effect of precursor on structure and properties; Carbon; 38: 953–964 (2000).
- M. Inagaki, T. Morishita, A. Kuno, T. Kito, M. Hirano and T. Suwa; Carbon foams prepared from polyimide using urethane foam template; Carbon. 42: 497–508 (2004).
- A. Marcilla, J.A. Conesa, M. Asensio and S.M. García-García; Thermal treatment and foaming of chars obtained from almond shells: kinetic study; Fuel. 79: 829–836 (2000).
- R.V.R.A. Rios, M. Martínez-Escandell, M. Molina-Sabio and F. Rodríguez-Reinoso; Carbon foam prepared by pyrolysis of olive stones under steam; Carbon. 44: 1448–1459 (2006).
- R. Santamaría-Ramírez, E. Romero-Palazón, C. Gómez-de-Salazar, F. Rodríguez-Reinoso, S. Martíınez-Saez and M. Martínez-Escandell; Influence of pressure variations on the formation and development of mesophase in a petroleum residue; Carbon. 37: 4455–4467 (1999).
- L. Temdrara, A. Khelifi, A. Addoum and N. Spahis; Study of the adsorption properties of lignocellulosic material activated chemically by gas adsorption and immersion calorimetry; Desalination, 223: 274–282 (2008).
- G.A.Rodriguez, L. Giraldo and J.C. Moreno; Calorimetric study of the immersion enthalpies of activated carbon cloths in different solvents and aqueous solutions; J Therm Anal Calorim. 96: 547–552 (2009).
- J.C. Moreno, L. Giraldo, A. Gomez, A Heat-conduction flow microcalorimeter for solute transfer enthalpy determinations: design and calibrations; Instrum Sci Technol. 26: 533–541 (1998).
- V. García, J.C. Moreno, L. Giraldo, K. Sapag and G. Zgrablich; Adsorption microcalorimeter. Design and electric calibration; J. Therm. Anal. Calorim. doi:10.1007/s10973-009-0345-4.
- L. Giraldo and J.C. Moreno; Calorimetric determination of activated carbons in aqueous solutions; J Therm Anal Calorim. 89: 589–594 (2007).
- C.M. Diaz, N. Briceño, M.C.Baquero, L.Giraldo and J.C. Moreno; Influence of temperature in the processes of carbonization and activation with CO2 in the obtainment of activated carbon from African Palm pit. Study of the modification of characterization parameters; Int J Chem. 6: 15–21 (2003).
- L. Giraldo, J.C. Moreno and J.I. Huertas; A heat conduction microcalorimeter for determination of the immersion heats of activated carbons into aqueous solutions; Inst Sci Technol. 30: 177–186 (2002).
- D. Kumar, K. Schumacher, C. du Fresne von Hohenesche, M. Grun and K.K. Unger; MCM-41, MCM-48 and related mesoporous adsorbents: their synthesis and characterisation, Colloids Surf. 109: 187–195 (2001).
- K.S.W. Sing, D.H. Everett, R.A. Haul, L. Moscou, R.A. Pirotti, J. Rouquerol and T. Siemieniewska; Reportinh physisorption data for gas/solids systems with Special Reference to the Determination of Surface Area and Porosity, Pure Appl. Chem. 57: 603–612 (1985).
- M. Kruk, M. Jaroniec, R. Ryoo and J.M. Kim; Monitoring of the structure of siliceous mesoporous molecular sieves tailored using different synthesis conditions, Microporous Mater. 12: 93–103 (1997).
- E.P. Barrett, L.G. Joyner and P.P. Halenda; The Determination of Pore Volume and Area Distributions in Porous Substances. I. Computations from Nitrogen Isotherms, J. Am. Chem. Soc. 73: 373–381 (1951).
- C. León y León, J,M. Solar, V.Calemma and L.R. Radovic; Evidence for the protonation of basal plane sites on carbonCarbon, 30: 797–812 (1992).
- G. Newcombe, R. Hayes and M. Drikas; Granular activated carbon : importance of surface properties in the adsorption of naturally occurring organics. Colloids Surf A, 78: 65–78 (1993).
- M.V. Lopez-Ramon, F. Stoeckli, C. Moreno-Castill and F. Carrasco-Marin; On the characterization of acidic and basic surface sites on carbons by various techniques, Carbon, 37: 1215–1221 (1999).
- J.C. Moreno-Pirajan and L. Giraldo; Determination of the immersion enthalpy of activated carbon by microcalorimetry of the heat conduction; Inst. Sci. and Tech. 28, 171–178 (2000).
- D. Blanco, L. Giraldo and J.C. Moreno; Immersion enthalpy of carbonaceous samples in aqueous solutions of monohydroxilated phenols; J. Therm. Anal. Calorim., 96: 853–857 (2009).
- D.P. Vargas, L. Giraldo and J.C. Moreno-Piraján; Enthalpic characterization of activated carbon monoliths obtained from lignocellulosic materials; Therm. Anal. Cal., 109: (2012), DOI 10.1007/s10973-012-2513-1
- P. Rodríguez-Estupiñán, J.C. Moreno-Piraján and L. Giraldo; Ni(II) adsorption on activated carbon. Relationship between physicochemical properties and adsorption capacity; Ads. Sci. & Tech. 29: 541–552 (2011).
- J.C. Moreno-Piraján, L. Giraldo, V.S. García-Cuello, D.P. Vargas-Delgadillo, P. Rodríguez-Estupiñán, Y.S. Murillo-Acevedo and M. Cantillo; Interaction thermodynamics between gas-solid and solid-liquid on carbon materials. In: Thermodynamics /Book 1. Rijeka, Croatia: INTECH; 2011.pp.164–195.

This work is licensed under a Creative Commons Attribution 4.0 International License.
About The Author
![]()
A New Edition of Web of Science
Journal Impact Factor
2022: 0.5
Five Year: 0.8
Journal is Indexed in

Cabells Whitelist
![]()


