Dissolution of wood flour and lignin in 1-butyl-3-methyl-1-imidazolium chloride
Yasmin Nasiri Khonsari1*, Seyyed Ahmad Mirshokraei2, Ali Abdolkhani3
1M.Sc. Organic Chemistry, Power and Water University of Technology, Tehran, Iran. 2Professor, Department of Chemistry, Payam Noor University of Tehran, Iran. 3Assistant Professor, Department of Wood and Paper Science, College of Natural Resources, Tehran University, Iran.
DOI : http://dx.doi.org/10.13005/ojc/290306
Article Received on :
Article Accepted on :
Article Published : 28 Oct 2013
The ionic solvent, 1-butyl-3-methyl imidazolium chloride was used to dissolve the samples. Two lignocellulosic material including bagasse soda lignin and Populus deltoides wood flour were used. One gram of samples were dissolved in 10 ml ionic solvent, 1-butyl-3-methyl- imidazolium chloride at 70 ºC for 72 h while stirring with a magnetic stirrer. The wood flour and lignin samples were acetylated with addition of acetic anhydride to each container with a ratio of 0.25 ml/ 0.25 ml. The samples were heated for 3 days at 110 ° C. Two control samples (without acetylation) and two treatments (acetylation) were used. The functional groups were determined using FT-IR Spectrometer. The number and type of carbon and their structure were examined using 13CNMR Spectrometer. The guaiacyl, syringyl, coniferyl alcohol and biphenyls structures were identified.
KEYWORDS:Wood, Lignin;1-butyl-3-methyl-1-imidazolium chloride;Solvent, Dissolution, FT-IR Spectrometer;13CNMR Spectrometer
Download this article as:| Copy the following to cite this article: Khonsari Y. L, Mirshokraei S. A, Abdolkhani A. Dissolution of wood flour and lignin in 1-butyl-3-methyl-1-imidazolium chloride. Orient J Chem 2013;29(3) |
| Copy the following to cite this URL: Khonsari Y. L, Mirshokraei S. A, Abdolkhani A. Dissolution of wood flour and lignin in 1-butyl-3-methyl-1-imidazolium chloride. Orient J Chem 2013;29(3). Available from: http://www.orientjchem.org/?p=266 |
Introduction
Lignin is the second most abundant natural polymer. So far, suitable industrial applications have not been found for lignin. The reason for this is the lack of adequate studies on the chemical structure of this biological polymer [1, 2]. Annually, approximately 58.1 tons of pulp is produced throughout the world. Lignin is the byproduct of pulp production industry. Due to the high volume of pulp production, one can expect that a large amount of lignin is produced annually as solution is the baking liquid. Industrial, Kraft, soda lignins and those produced in semi-chemical processes are of this category [3]. These lignins have also often dense chemical structure and therefore are insoluble in most organic solvents. This limits examining the chemical structure of lignin. Kraft and soda lignin are insoluble in common organic solvents for spectroscopy studies. This is due to the high percentage of C-C bonds produced in the lignin structure more or less during baking [4]. In general, if the lignin can be solved, its chemical structure can be studied. Few studies have been done in this area.
Ionic solvents such as 1-ethyl-3-methyl-imidazolium chloride [C2mim] [CL], 1-butyl-3- methyl imidazolium 3-fluoro methane sulfonate [bmim] [OTF], 1-butyl-3-methyl imidazolium hexafluoro phosphate [bmim] [PF6], 1-butyl-3-methyl imidazolium lactate [bmim] [lactate], and 1-butyl-3-methyl imidazolium tetrafluoroborate [bmim] [BF4] are capable of dissolving wood [5, 6]. It seems that the use of these solvents may provide an opportunity for dissolution and studying various types of lignins including industrial lignin [7, 8, and 9]. In this study, an industrial lignin (soda) was dissolved in an ionic solvent, 1-butyl 3-methyl-imidazolium chloride [BMIMCl] and its chemical structure was studied using spectroscopy methods. The dissolution of cellulose and wood flour in the ionic solvent, 1-butyl-3- methyl imidazolium chloride was also examined. Due to the large volume of industrial lignin, the chemical structure of industrial lignins and the chemical reactions involved in chemical curing process as well as the mechanism for converting this polymer into other good and valuable chemical products can be studied using this method.
Materials and Methods
Materials
Two lignocellulosic materials were used:
Populus deltoides wood flour with a sieve (200 mesh) was completely powdered by ball milling.
Lignin: the liquor of baking soda process was precipitated by sulfuric acid and then centrifuged. The lignin was extracted as follows:
The pH of the black liquor from baking soda process was reached close to zero by adding 4 N sulfuric acid (about 72%). Sulfuric acid reacts with lignin in alkaline solution, and converts lignin into water-insoluble form. Then, the lignin was precipitated and separated from solution by centrifugation. A mixture of lignin and salt water was poured into Falcon and placed in centrifuge device. The separation process was performed for 10 min at 1000 rpm. To ensure that all salt is removed from the mixture, the distilled water was again added to Falcon and stirred and then was centrifuged after filtering the salt water. The lignin was removed from the Falcon and transferred to an oven with a temperature of 60 ºC. The lignin was used after drying for 48 h.
Synthesis, Separation and Recycling Methods
First, the 1-chlorobutane (131.63 ml) and 1-methyl imidazole (79.33 ml) were mixed with a same molar ratio (1.26 mol). The mixture was poured into the balloon. The balloon was placed into the oil bath on a heater or magnetic stirrer (magnet located inside the balloon). A condenser with cooling water flow was placed on the balloon to isolate the system. The mixture was stirred by a magnetic stirrer with a speed of 500 rpm at 70 ºC for 3 days (72 h). Thus, the ionic solvent, 1-butyl-3-methyl-imidazolium chloride was produced. After completion of the synthesis, the ionic liquid was purified. Thus, the as-synthesized 1-butyl-3- methyl- imidazolium chloride was poured into the funnel separator and then ethyl acetate was added, half the volume of the ionic solvent (about 100 mL) to dissolve and remove imidazole, and neutralized butyl chloride form the ionic solvent, 1-butyl-3-methyl- imidazolium chloride. Ethyl acetate was stirred vigorously for 10 min. A two-phase mixture was formed. The upper colorless substance on the surface, i.e. ethyl acetate, was removed from the surface of ionic solvent, 1-butyl-3-methyl-imidazolium chloride. This procedure was repeated 3 times. Then, the ethyl acetate remaining in the ionic solvent, 1-butyl-3-methyl-imidazolium chloride was recycled by evaporation and purified 1-butyl-3-methyl-imidazolium chloride was obtained (the color of purified ionic solvent is pale yellow.
The reactions are as follows. (Fig. 1)
The dissolution process
Ionic solvent, 1-butyl-3-methyl-imidazolium chloride and the lignocellulosic material (bagasse lignin, Populus deltoides wood flour) were poured into a capped glass container with a ratio of 10ml: 1g (two containers for each substance). A magnet was put on the container and it then put into the oil bath on a magnetic stirrer with a temperature of 70ºC. After several hours, due to increasing the viscosity by dissolution, the temperature raised to 110ºC. The time for complete dissolution was 3 days.
The acetylation process
Acetylation process was performed on wood flour and lignin treatments. Five drops of acetic anhydride (0.25 ml) was added to 0.5 ml of solution. The mixture was stirred on a magnetic stirrer at 110ºC for 72 h (3 days). In subsequent studies, two control samples (non- acetylated) and acetylated treatments were used.
Populus deltoides wood flour and soda bagasse lignin (acetylated and non-acetylated) samples dissolved in DMSO were used in FT-IR and 13CNMR spectroscopy studies. The various functional groups in Populus deltoides wood flour, soda bagasse lignin (acetylated and non-acetylated) and cellulose (not acetylated) were determined by a FT-IT Spectrophotometer (Perkin-Elmer Spectrum RXI). The type and number of carbons and the chemical structures in Populus deltoides wood flour (acetylated and non-acetylated) and soda bagasse lignin (acetylated and non-acetylated) were identified using 13CNMR (Avance, Bruker) with a frequency of 400 MHz. The resulting spectrum of the extract obtained from dissolution of Populus deltoides and bagasse soda lignin in DMSO-d6 was placed for 1 day in the 13CNMR spectrophotometer.
Results
FT-IR spectroscopy
FT-IR spectra of non-acetylated bagasse soda lignin
The band corresponding to stretching mode of hydrogen (OH, alcohol or phenol) appears at 3424.38 cm-1.(Fig 2)
The bands appears at 2086.31-3148.71 cm-1 correspond to stretching mode of C-H in alkanes (methyl and methylene groups). The band corresponding to stretching mode of C-H, SP2 in aromatics appears at 3148.71 cm-1. The bands corresponding to stretching mode of C-H, SP3 appear at 2960 to 3084.01 cm-1. The band corresponding to asymmetric stretching mode of CH2-SP3 appears at 2936.14 cm-1, because it has a large dipole moment. The band corresponding to symmetric stretching mode of CH3-SP3 appears at 2875.67 cm-1. The bands correspond to stretching mode of C-H of hydrocarbon appears at 2086.31 cm-1.
The band corresponding to stretching mode of alkene C=C bond appears at 1635 cm-1 indicating aromatic ring.
The band appeared at 1634.83 cm-1 can be correspond to the stretching mode of carbonyl group. The absorption frequency has been decreased due to unsaturated alpha-and beta-carbon coupling or ring stretching.
The bands corresponding to stretching mode of aromatic C-C, SP2 appear at 1520.53 to 1572 cm-1.
The bands corresponding to bending scissoring mode of CH2 appear at 1429.82 to 1466.82 cm-1, which is characteristic of lignin. If it is connected directly to the carbonyl group, and strong absorption will be appeared which is not the case here.
The band corresponding to asymmetric bending of CH3 appears at 1382.31 cm-1.
Since the hydrocarbon is cyclic, the symmetric bending mode of CH3 is not observed at 1375 cm‑1.
The bands appeared at 1049.04, 1068.85, 1112.99, 1168.79, 1232.15 and 1337.14 cm-1 represent the stretching mode of C-O-C used to determine the primary, secondary and tertiary alcohols or phenol. For alkyl aryl ethers compounds, a strong absorption corresponding to asymmetric stretching mode of C-O-C appears at 1168.79 cm-1. A weak absorption corresponding to the symmetric stretching mode of C-O-C appears at 1049.04 cm-1. For dialkyl ethers compounds, a strong absorption corresponding to asymmetric stretching mode of C-O-C appears at 1168.79 cm-1. A weak absorption corresponding to the symmetric stretching mode of C-O-C appears at 844.45 cm-1. A strong absorption corresponding to asymmetric stretching mode of C-O-C attributed to 6-sided oxygen containing rings appears at 1168.79.
The band corresponding to alkyl substituted alkene appears at 910 cm-1. When connected to a double bond, it pulls electrons through resonance and the band shifts to higher wavenumbers and appears at about 950.11 cm-1 which shows C-C, SP2 in alkenes.
The bands appeared at 653.51, 754.93 and 844.45 cm-1 correspond to out of plane bending vibration of the meta bi-substituted ring (meta sub opp). The band appeared at 653.51 to 754.93 cm-1 can be attributed to the mono-substituted rings in the structure of compounds.
The bands appeared at 622.22, 653.51, 754.93 and 844.45 cm-1 correspond to out of plane bending of C-H. The opp band is indicative of mono and bi substituted rings.
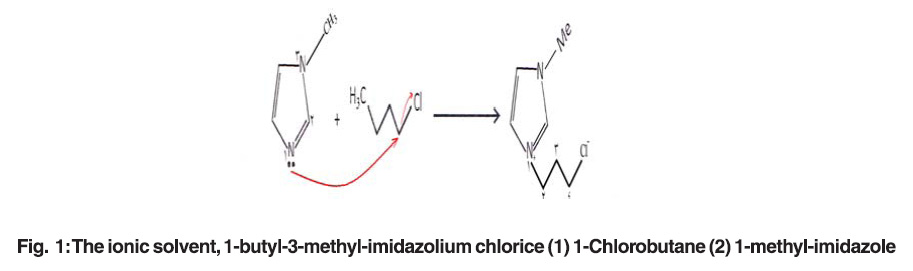 |
Fig. 1: The ionic solvent, 1-butyl-3-methyl-imidazolium chlorice (1) 1-Chlorobutane (2) 1-methyl-imidazole Click here to View figure |
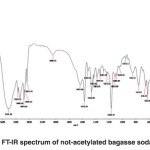 |
Fig. 2: FT-IR spectrum of not-acetylated bagasse soda lignin Click here to View figure |
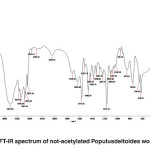 |
Fig. 3: FT-IR spectrum of not-acetylated Populusdeltoides wood flour Click here to View figure |
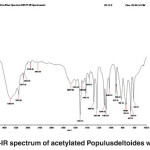 |
Fig. 4: FT-IR spectrum of acetylated Populusdeltoides wood flour Click here to View figure |
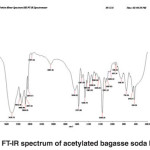 |
Fig. 5: FT-IR spectrum of acetylated bagasse soda lignin Click here to View figure |
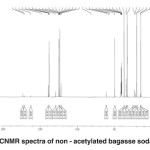 |
Fig. 6: CNMR spectra of non – acetylated bagasse soda lignin Click here to View figure |
FT-IR spectra of non-acetylated Populus deltoides wood flour
The band corresponding to the stretching mode of hydrogen (OH, alcohol or phenol) appears at 3424.38 cm-1. (Fig. 3)
The bands appear at 2084.22-3148.13 cm-1 correspond to stretching mode of C-H in alkanes (methyl and methylene groups). The band corresponding to stretching mode of C-H, SP2 in aromatics appears at 3145.13 cm-1. The bands corresponding to stretching mode of C-H, SP3 appear at 2960.14 to 3084.99 cm-1. The band corresponding to symmetric stretching mode of CH2-SP3 appears at 2935.09 cm-1. The band corresponding to symmetric stretching mode of CH3-SP3 appears at 2875.76 cm-1. The couple bands correspond to stretching mode of C-H appear at 2743.42 cm-1 which is used to distinguish aldehyde from ketone. A few bands corresponding to C-H are observed at 2084.22 to 2583.31 cm-1.
The band corresponding to stretching mode of aldehyde carbonyl bond appears at 1718.16 cm-1. Its absorption frequency reduced due to coupled system, unsaturated alpha and beta carbon and conjugated carbonyl in wood flour lignin.
The band corresponding to stretching mode of C=C in alkene appears at 1634.83 cm-1 indicative of aromatic ring.
The band appeared at 1634.83 cm-1 can be correspond to the stretching mode of carbonyl group. The absorption frequency has been decreased due to unsaturated alpha-and beta-carbon coupling or ring stretching.
The bands corresponding to bending scissoring mode of CH2 appear at 1429.82 to 1466.82 cm-1, which is characteristic of lignin. If it is connected directly to the carbonyl group, and strong absorption will be appeared which is not the case here.
The band corresponding to asymmetric bending of CH3 appears at 1382.31 cm-1.
Since the hydrocarbon is cyclic, the symmetric bending mode of CH3 is not observed at 1375 cm‑1.
The bands corresponding to stretching mode of aromatic C=C appear at 1521.53 to 1573.60 cm-1.
The bands corresponding to bending scissoring mode of CH2 appear at 1430.43 to 1466.14 cm-1, which is characteristic of lignin.
The band corresponding to asymmetric bending of CH3 appears at 1384.74 cm-1.
The bands appeared at 1028.29, 1054.67, 1175.70, 1234.11, 1284.87 and 1338.66 cm-1 represent the stretching mode of C-O-C used to determine the primary, secondary and tertiary alcohols or phenol. For alkyl aryl ethers compounds, a strong absorption corresponding to asymmetric stretching mode of C-O-C appears at 1171.70 cm-1. A weak absorption corresponding to the symmetric stretching mode of C-O-C appears at 1028.29 cm-1. For dialkyl ethers compounds, a strong absorption corresponding to asymmetric stretching mode of C-O-C appears at 1171.70 cm-1. A weak absorption corresponding to the symmetric stretching mode of C-O-C appears at 850.98 cm-1. A strong absorption corresponding to asymmetric stretching mode of C-O-C attributed to 6-sided oxygen-containing rings appears at 1171.70.
The band corresponding to alkyl substituted alkene appears at 910 cm-1. When connected to a double bond, it pulls electrons through resonance and the band shifts to higher wavenumbers and appears at about 950.19 cm-1 which shows C-C, SP2 in alkenes.
The bands appeared at 654, 755.61 and 850.98 cm-1 correspond to out of plane bending vibration of the meta bi-substituted ring (meta sub opp). The band appeared at 653.51 to 754.93 cm-1 can be attributed to the mono-substituted rings in the structure of compounds.
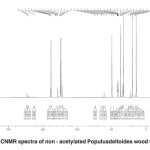 |
Fig. 7: CNMR spectra of non – acetylated Populusdeltoides wood flour Click here to View figure |
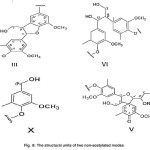 |
Fig. 8: The structural units of two non-acetylated modes Click here to View figure |
The bands appeared at 624.94, 654, 755.61 cm-1 correspond to out of plane bending of C-H. The opp band is indicative of mono and bi substituted rings.
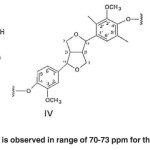 |
Fig. 9: No spectrum is observed in range of 70-73 ppm for the bagasse soda lignin Click here to View figure |
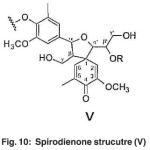 |
Fig. 10: Spirodienone strucutre (V) Click here to View figure |
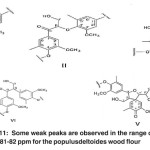 |
Fig. 11: Some weak peaks are observed in the range of 81-82 ppm for the populusdeltoides wood flour Click here to View figure |
FT-IR spectra of acetylated Populus deltoides wood flour
The band corresponding to the stretching mode of hydrogen (OH, alcohol or phenol) appears at 3386.99 cm-1. (Fig. 4)
The bands appears at 2922.99-311.81 cm-1 correspond to stretching mode of C-H in alkanes (methyl and methylene groups). The band corresponding to stretching mode of C-H, SP2 in aromatics appears at 3113.81 cm-1. The band corresponding to stretching mode of C-H, SP3 appears at 2955.02 cm-1. The band corresponding to symmetric stretching mode of CH2-SP3 appears at 2922.99 cm-1. In acetylated state (C-H), its peak intensity represents a new functional group attached to the C-H bond.
The band corresponding to aldehyde or anhydride carbonyl appears at 2714.69 cm-1.
The band corresponding to aldehyde or anhydride (CH, SP2) appears at 2466.60 cm-1 which is a sign of acetylation.
The bands appeared at 1472.03, 1519.70 and 1592.63 cm-1 correspond to stretching vibration of aromatic structure (C-C, SP2) derived from lignin.
The band corresponding to stretching mode of aldehyde or ketone carbonyl in the lignin or hemicellulose appears at 1677.93 cm-1. The band is weak due to the coupling of unsaturated alpha-and beta-carbons.
The band corresponding to asymmetric bending of CH3 appears at 1421.42 cm-1.
The bands appeared at 1029.23, 1082.15, 1109.08, 1233.08, 1286.32 and 1364.35 cm-1 represent the stretching mode of C-O-C. For alkyl aryl ethers compounds, a strong absorption corresponding to asymmetric stretching mode of C-O-C appears at 1082.15 and 1233.08 cm-1. A weak absorption corresponding to the symmetric stretching mode of C-O-C appears at 1029.23 cm-1. For dialkyl ethers compounds, a strong absorption corresponding to asymmetric stretching mode of C-O-C appears at 1082.15 and 1233.08 cm-1. A weak absorption corresponding to the symmetric stretching mode of C-O-C appears at 824.26 cm-1. A strong absorption corresponding to asymmetric stretching mode of C-O-C attributed to 6-sided oxygen containing rings appears at 1082.15 and 1233.08 cm-1.
The band appeared at 1364.35 cm-1 may correspond either to bending mode of C-H in cellulose or C-H deformation in lignin.
The band appeared at 1029.23 cm-1 may correspond either to deformation of the aromatic guaiacyl type plane and C-O deformation or first type alcohol.
The bands appeared at 661.10, 665.51, 742.41, 747.78 and 824.26 cm-1 correspond to out of plane bending vibration of the meta bi-substituted ring (meta sub opp). The band appeared at 661.10, 665.51, 742.41, 747.78 can be attributed to the mono-substituted rings in the structure of compounds.
The bands appeared at 616.47, 661.10, 665.51, 742.41, 748.87 and 824.26 cm-1 correspond to out of plane bending of C-H in lignin.
FT-IR spectra of acetylated bagasse soda lignin
The band corresponding to the stretching mode of hydrogen (OH, alcohol or phenol) appears at 3421.73 cm-1. The intensity and width of this band is higher than that of Populus deltoides.
The bands appear at 2094.16-2960.01 cm-1 corresponds to stretching mode of C-H in alkanes (methyl and methylene groups). The band corresponding to stretching mode of C-H, SP2 in aromatics or alkenes appears at 3083 to 3146.50 cm-1. The band corresponding to stretching mode of C-H, SP3 appears at 2960.01 cm-1. The band corresponding to asymmetric stretching mode of CH2-SP3 appears at 2937.11 cm-1. The band corresponding to symmetric stretching mode of CH3, SP3 appears at 2874.45 cm-1. The couple bands corresponding to stretching mode of C-H appear at 2737.66 cm-1. A few bands corresponding to hydrocarbon C-H appear at 2094.16 cm-1.(Fig. 5)
The band corresponding to stretching mode of carbonyl appears at 1636.01 cm-1. The band is weak due to the coupling of unsaturated alpha-and beta-carbons.
The bands appeared at 1517.99 to 1572.98 cm-1 corresponds to aromatic C-C, SP2.
The band corresponding to bending scissoring of CH2 appears at 1466.74 cm-1.
The bands corresponding to asymmetric bending of CH3 (tertiary butyl compounds) appear at 1382.91 and 1429.63 cm-1.
The bands appeared at 1029.23, 1082.15, 1109.08, 1233.08, 1286.32 and 1364.35 cm-1 represent the stretching mode of C-O-C. For alkyl aryl ethers compounds, a strong absorption corresponding to asymmetric stretching mode of C-O-C appears at 1082.15 and 1233.08 cm-1. A weak absorption corresponding to the symmetric stretching mode of C-O-C appears at 1029.23 cm-1. For dialkyl ethers compounds, a strong absorption corresponding to asymmetric stretching mode of C-O-C appears at 1082.15 and 1233.08 cm-1. A weak absorption corresponding to the symmetric stretching mode of C-O-C appears at 824.26 cm-1. A strong absorption corresponding to asymmetric stretching mode of C-O-C attributed to 6-sided oxygen containing rings appears at 1082.15 and 1233.08 cm-1.
The band corresponding to alkyl substituted alkene appears at 910 cm-1. When connected to a double bond, it pulls electrons through resonance and the band shifts to higher wavenumbers and appears at about 950.19 cm-1 which shows C-C, SP2 in alkenes.
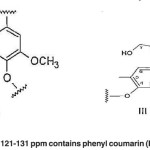 |
Fig. 12: The aromatic region of 121-131 ppm contains phenyl coumarin (III) or biphenyl structures (XIV) Click here to View figure |
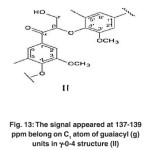 |
Fig. 13: The signal appeared at 137-139 ppm belong on C1 atom of guaiacyl (g) units in γ-0-4 structure (II) Click here to View figure |
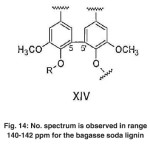 |
Fig. 14: No. spectrum is observed in range 140-142 ppm for the bagasse soda lignin Click here to View figure |
The bands appeared at 653.65, 759.56 and 846.59 cm-1 correspond to out of plane bending vibration of the meta bi-substituted ring (meta sub opp). The band appeared at 622.31, 653.65, 759.56 and 846.59 cm-1 can be attributed to the out of plane bending of C-H.
13CNMR spectroscopy
2.1. 13CNMR spectra of non-acetylated bagasse soda lignin (Fig. 6)
2.2. 13CNMR spectra of non-acetylated Populus deltoides wood flour (Fig. 7)
The structural units of two non-acetylated modes (Fig. 8)
(γ-OH) is observed in spirodienone structure (V). The γ-carbon atoms attached to the hydroxyl group was found the β-1 (ΙV) structure. The γ-carbon atoms attached to the hydroxyl group is observed in phenyl coumarin structure (ΙΙΙ). The α-carbon atoms attached to the hydroxyl group is found in the structure (X). Using the spirodienone structure (V), it can be concluded both guaiacyl and syringyl structures could be existed.
The signals appeared at 70-73 ppm in Populus deltoides wood flour correspond to the α-carbon atoms attached to the hydroxyl (α-OH) in β-O-4 structure (Ι), α-carbon atoms attached to the hydroxyl in the β-1 structure (ΙV), γ-carbon atoms attached to oxygen (Cγ-o) and carbohydrate carbon atoms in pino-/syringaresinol structure (β-β) (IV). No spectrum is observed in range of 70-73 ppm for the bagasse soda lignin. (Fig. 9)
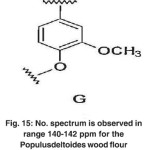 |
Fig. 15: No. spectrum is observed in range 140-142 ppm for the Populusdeltoides wood flour Click here to View figure |
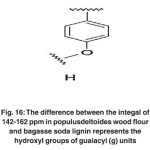 |
Fig. 16: The difference between the integal of 142-162 ppm in populusdeltoides wood flour and bagasse soda lignin represents the hydroxyl groups of guaiacyl (g) units Click here to View figure |
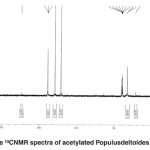 |
Fig. 17: The ¹³CNMR spectra of acetylated Populusdeltoides wood flour Click here to View figure |
The cluster signal observed at 56-64 ppm in both compounds corresponds to the β- carbon atoms in Spirodienone structure (V). (Fig. 10)
The cluster signal observed at 64-73 ppm in Populus deltoides wood flour belongs to the γ atoms in γ-o-Alk. No spectrum is observed in range of 70-73 ppm for the bagasse soda lignin.
The signals appeared at 81-82 ppm in the bagasse soda lignin correspond to the β-carbon atoms attached to oxygen and the α-carbon atoms in β-o-4 structure (I), β-carbon atoms attached to oxygen and α-carbon atoms in β-o-4 structure (II), α-carbon atoms attached to β-o-4 units in spirodienone structure (V), α-carbon atoms in phenyl coumarin structure (III) and α-carbon atoms in pino-/syringaresinol structure (β-β) (IV). Some weak peaks are observed in the range of 81-82 ppm for the Populus deltoides wood flour. (Fig. 11)
The aromatic region of 121-131 ppm contains phenyl coumarin (III) or biphenyl structures (XIV). (Fig. 12)
The signals appeared at 137-139 ppm belong to C1 atoms of guaiacyl (g) units in β-o-4 structure (II). (Fig. 13)
The signals appeared at 140-142 ppm in the lignin of Populus deltoides wood flour correspond to C4́ and C4 of aromatic bonds in biphenyl structure (5-5’) (VIX). No spectrum is observed in range of 140-142 ppm for the bagasse soda lignin. (Fig. 14)
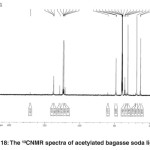 |
Fig. 18: The ¹³CNMR spectra of acetylated bagasse soda lignin Click here to View figure |
The signal appeared at 148 ppm in bagasse soda lignin has a single spectrum corresponding to C3 of non-condensed aromatic connections in guaiacyl (g). No spectrum is observed in range of 140-142 ppm for Populus deltoides wood flour.(Fig. 15)
The signal appeared at 162 ppm corresponds to C-4 attached to oxygen in paracoumaryl alcohol (h) which is observed in both Populus deltoides wood flour and bagasse soda lignin.
The difference between the integral of 142-162 ppm in Populus deltoides wood flour and bagasse soda lignin represents the hydroxyl groups of guaiacyl (g) units. (Fig. 16)
The signal appeared at 171-173 ppm contains aliphatic COOR groups observed in Populus deltoides wood flour and the soda bagasse lignin.
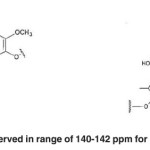 |
Fig. 19: No spectrum is observed in range of 140-142 ppm for Populusdeltoides wood flour Click here to View figure |
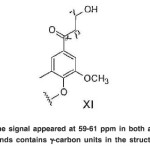 |
Fig. 20: The signal appeared at 59-61 ppm in both acetylated compounds contains γ-carbon units in the structure (XI) Click here to View figure |
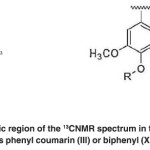 |
Fig. 21: The aromatic region of the 13CNMR spectrum in the range of 120-128 ppm includes phenyl coumarin (III) or biphenyl (XIV) structures Click here to View figure |
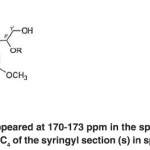 |
Fig. 22: The spectrum appeared at 170-173 ppm in the spectra of both acetylated compounds contains the C4 of the syringyl section (s) in spirodienone structure (V) Click here to View table |
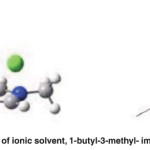 |
Fig. 23: The chemical structure of ionic solvent, 1-butyl-3-methyl- imidazolium chloride [BMIM] [Cl] Click here to View figure |
The 13CNMR spectra of acetylated Populus deltoides wood flour( Fig. 17)
The 13CNMR spectra of acetylated bagasse soda lignin (Fig. 18)
Analysis of the structural units in acetylated form
The signal appeared at 38-40 ppm in the acetylated bagasse soda lignin as 7 high peaks (due to high concentration of DMSO) and in the acetylated Populus deltoides wood flour as 7 short peaks (due to the low concentration of DMSO) has an unknown structure.
The signal appeared at 47-48 ppm (3 peaks) in the acetylated bagasse soda lignin corresponds to the β-carbon atoms in the β-1 structure (VI) and β-carbon atoms in the phenyl coumarin (III). No spectrum is observed in range of 140-142 ppm for Populus deltoides wood flour. (Fig. 19)
The signal appeared at 59-61 ppm in both acetylated compounds contains γ-carbon units in the structure (XI).(Fig. 20)
The signal appeared at 59-61 ppm in both acetylated compounds contains clustered OHpri.
The aromatic region of the 13CNMR spectrum in the range of 120-128 ppm includes phenyl coumarin (III) or biphenyl (XIV) structures. (Fig. 21)
The spectrum appeared at 170-173 ppm in the spectra of both acetylated compounds contains the C4 of the syringyl section (s) in spirodienone structure (V). (Fig. 22)
Discussion
Reaction time and temperature
The wood structure is complex because of cellulose, hemicellulose and lignin. There are many bonds such as hydrogen bonding and covalent bonds between the inner and outer molecules of the wood. Therefore, more energy is required to break these bonds [1, 2]. So the wood liquefaction reaction is generally carried out at high temperatures. Ionic liquids keep the temperature low and the temperature changes with the molecular structure of ionic liquids. The liquefaction yield in [BMIM] [Cl] is about 80%. The benefits of ionic liquids are more obvious in their effects on reaction time and temperature. ( Fig. 23)
The structure of ionic liquids
The cationic structure
The imidazole substitutes the cationic portion of the ionic liquid which is an alkyl-substituted group. An alkyl group has a long chain for effective distribution of the electrical charge and lowers the melting point of ionic liquids. In the course of wood liquefaction, ionic liquids with low melting point have a wide range of liquefaction in which the concentration and acidity of the functional group increases. This feature improves liquefaction. The wood liquefaction by the ionic liquid, 1-butyl-3-methyl imidazolium chloride provides a good temperature stability. The energy between carbon, hydrogen and delocalized atoms in this ionic liquid is strong. This strong force increases the thermal stability of ionic liquids, and ensures the ability to dynamical control of liquefaction and the activity of functional groups [10, 11].
The anionic structure
The liquefaction yield of [BMIM] [Cl] is not as well as [BMM] [Cl/AlCl3]. The difference is attributed to their atomic structures. The anion [Cl/MCln] formed by metal chlorides of [Cl] and [MCln] can alter the pH of ionic liquids. For example, in the case of [Cl/AlCl3], when N (the mole fraction of AlCl3 in ionic liquid) is 0.5, i.e. a 1:1 mixture of [BMIM], the theoretical chemical equilibrium is as follows: Cl¯+AlCl3↔AlCl ¯ 4 and the resulting [BMIM] [Cl] is neutral. At higher mole fractions, more equilibrium are formed such as (Al2Cl ¯ 7 ↔ Cl¯+AlCl4) and (Al2Cl¯ 7 + AlCl3 ↔ Al3Cl ¯ 10). The high acidity of these equilibrium reactions comes from Al2Cl ¯ 7. Al3Cl¯10 accelerates breakage of covalent bonds in the wood structure, greatly reduces the reaction temperature and reduce reaction time. For all cases, the structure of [Cl/MCln)) is responsible for the acidity of the ionic liquid.
The anionic structure of ionic liquids can be directly regulated by capacity and the type of [MCln]. First, by increasing the capacity of [MCln] -i.e. increasing the capacity of N- the acidity of [MCln] increases. Increased acidity induces changes in ionic liquids adhesion. The negative charges are distributed better because of AlCl4, and then the hydrogen bonds in the imidazolium cation become weak to reduce the adhesion of ionic liquids.
The ability to recycle the ionic liquid
The ionic liquid may be separated from the products based on good thermal stability, lack of vapor tension and the lack of any azeotrope. The recycled ionic liquid could be used three times for wood liquefaction to maintain the initial level of liquefaction with minimal changes in the liquefaction activity. It has been found that this ionic liquid can be recycled as a wood liquefaction reagent.
Lack of high-speed operation is one of disadvantages in our measurements. Because, for high-viscous samples such as lignin and cellulose, the samples should be placed in 13CNMR spectrometer for 24 to 48 h; usually this operation will damage the device during a long time and actually can cause failure of the device.
Conclusion
Wood liquefaction is achieved using ionic liquid, 1-butyl-3-methyl imidazolium chloride as liquefaction reagent at low temperature. The ionic liquids with acidic anionic groups such as [Cl/AlCl3] have high liquefaction yields in the same conditions. Ionic liquids significantly reduced liquefaction time and temperature. The liquid to wood ratio of these ionic liquids accelerated the reaction and increased access to liquefaction. The liquefaction feature of ionic liquids depends on their molecular structure. The anionic group, [Cl/AlCln], equipped ionic liquids with Lewis acid to increase the breakage of bonds such as hydrogen bonds in cellulose, hemicellulose and lignin [12].
Although without acidic power, [Cl–] is a strong hydrogen bond acceptor and could weaken the hydrogen bonds. The cationic group of the alkyl chain results in asymmetry of the imidazole molecule structure, low melting point of ionic liquids and increased liquefaction range. Ionic liquids can be separated from the products after liquefaction. They can be recycled with appropriate activity [13]. Ionic liquids should be recycled with high recovery rate following wood liquefaction due to the relatively high price. The ionic liquids with appropriate activity and recycling rate may be used as an alternative for the existing liquefaction reagents. The relationship between the molecular structure of the ionic liquid and wood liquefaction properties should be further investigated. The type and shape of anion and cation of the ionic liquid determine the melting point, thermal stability, adhesion, solubility, acidity, anionic coordination and etc. These properties can be set for wood liquefaction [14, 15, and 16].
The results showed that the ionic solvent, 1-butyl-3-methyl imidazolium chloride can dissolve cellulose, bagasse soda lignin and Populus deltoides wood flour and subsequently the wood will turn to liquid. According to the results, it can be concluded that this ionic solvent, not only as a solvent for wood components, but it could be used as a chemical reagent to turn them into lower molecular weight compounds. These findings suggest that the ionic solvent, 1-butyl-3-methyl imidazolium chloride can also be used for chemical conversion of wood and extraction of chemicals.
Suggestions
- The relationship between molecular structure of ionic liquid and wood liquefaction properties should be further investigated.
- Another ionic liquid may be used for recycling process.
- Kraft lignin can be used instead of soda lignin.
- The samples may be investigated by 13CNMR spectroscopy for 48 h.
References
- Principles of Instrumental Analysis by F. James Holler, Timothy A. Nieman and Douglas A. Skoog (1997), Translation: Salajegheh, A., Tehran University Publication Center, Fifth Edition, pp. 315-270, (2009)
- Hosseini, S.Z., Fibers morphology of wood and pulp, Gorgan: Agricultural Sciences and Natural Resources University Press, second edition, pp. 45-48, (2000)
- Raoofi, m.K. And Mallardi M.R., Principles of Industrial Water and Wastewater Treatment Tehran, Innovator Press, first edition, pp. 31-34, (2002)
- Sjostrom, E., Wood Chemistry Fundamentals and Applications, translation: Ahmad Mirshokraei, Tehran: Aeezh, Second Edition, Second Edition, pp. 1-50, (2007)
- Mirshokraei, S. A. And Yavari, Spectroscopy applications in organic chemistry, Payam noor University Press, (1992)
- Mohebbi, b. Acetylation of wood and lignocellulosic materials, Khorasan wood industry and University Conference, (2004)
- Daneshvar, N. A., Textbook of Industrial Water and Wastewater Treatment, Department of Applied Chemistry, Faculty of Chemistry, University of Tabriz
- Adams C.J., Earle M.J., Roberts G. , Seddon K.R., Green Chemistry. Commun, 2097 (1998)
- H Clark, J.(2009) Chemistry Green Books, UK,York: page Publication, (1986)
- A Krau, G. (2009), RSC Green Chemistry Books, LOWA, USA: page Publication: 1100, (2009)
- Kerton and Janse., Alternative Solvent For Green Chemistry, Canada: page Publication, 1235 (2009)
- Armor J.N., Applied Catalysis. A. General, 153,189 (1999)
- Earle M.J., Roberts G. , Seddon K.R., Green Chemistry for Solvent., (1999), 23-26
- Pagliaro, M. , The Future of Glycerro, CNR, Institute of Nanostructured Material and Institute For Scientific Methodology, Italy: Page Publication: 10-12 ( 2009)
- Rossi, M., Department Of Inorganic chemistry, University Of Milan, Italy: Page Publication:112, (2009)
- Farrouto R.J. and Heck R.M., Catalysis Today, 55, 179 (2000)

This work is licensed under a Creative Commons Attribution 4.0 International License.
![]()
A New Edition of Web of Science
Journal Impact Factor
2022: 0.5
Five Year: 0.8
Journal is Indexed in

Cabells Whitelist
![]()


