Contactless or High Frequency Conductometry or Oscillometry of Electrolytes
Kiumars Ghowsi1* and Hosein Ghowsi2
1Department of Chemistry Majlesi Branch, Islamic Azad University , Isfahan , Iran 2Department of Mathematics , Payame Noor University,Tehran,I.R.Iran
DOI : http://dx.doi.org/10.13005/ojc/290321
Article Received on :
Article Accepted on :
Article Published : 28 Oct 2013
Circuit models are used to express the behavior of the conductometric cells in the radio frequency to microwave region .The capacitive cell has two era classic era and modern era as a detector for Capillary Zone Electrophoresis . Capacitive Cell where electrodes are outside the Cells and frequency of the electric signal is in the cell the radio frequency range is modeled. Both microscopic phenomena occurring at radio frequencies in electrolytes and macroscopic phenomena the circuit model for the capacitive cell were obtained and plotted three dimensionally for the first time.
KEYWORDS:Conductometry;Oscillometry;Capacitive Cell;Capillary Zone Electrophoresis (CZE);Contactless Conductivity Detection;Electrolytes;Debye-Falkenhagen;High Frequency or Radio Frequency Conductometry;Ionic Atmosphere;Relaxation Time
Download this article as:| Copy the following to cite this article: Ghowsi K, Ghowsi H. Contactless or High Frequency Conductometry or Oscillometry of Electrolytes. Orient J Chem 2013;29(3). doi : http://dx.doi.org/10.13005/ojc/290321 |
| Copy the following to cite this URL: Rathore N, Kishan B. Synthesis and Characterization of Complexes of Glipizide with Zirconium and Cobalt. Orient J Chem 2013;29(3). Available from: http://www.orientjchem.org/?p=299 |
INTRODUCTION
In the high frequency conductometry an electrochemical cell in which a solution to be analyzed between external , Parallel metal sheet electrodes is called capacitive cell or codensor type cell. Since the solution is insulated from the metal plates by the walls of the container, it can be used only at high frequencies. The high frequency method was suggested first by Blake .
In this type of cell , the electrochemical reactions are not present to interefere with the conductance measurement since the electrodes are not in direct contact with the electrolyte. Reilley etal. have made an extensive study of the theory of high frequency titrations and their applications. Ermakov etal. have used this type of cell to study the structural properties of solutions. Forman etal . have used a capacitive cell in an attempt to verify experimentally the Debye-Falkenhagen effect.
It is interesting to abserve that high frequency conductometry is appearing in more applied science and Technology in recent years.High- frequency measurement of impedance of solutions , where the signal depends on electrical conductivity of the solution and the measuring electrodes need not be in direct contact with the solution has also been applied to Capillary Zone Electrophoresis (CZE) detection under the name “ contactless conductivity detection”.
The original contactless systems used for conductivity detection in flowing liquids , e.g. , were mechanically and electronically complicated. Recently , a new simplified constructions of contactless detectors , have been published .
This high frequency conductometry with such a long history has poorly understood or misrepresented some people claimed this system represent Debye-Falkenhagen effect. Let’s see what Debye-Falkenhagen effect is , and does high frequency conductometry describe Debye-Falkenhagen or not ?
Theory
The Debye-Falkenhagen theory for the dispersion of electrolyte conductance at high frequency was formulated in 1928 . The Debye-Falkenhagen effect , or dispersion of conductance , is the variation of conductance with frequency at high frequencies due to existence of ionic atmosphere with a finite time of relaxation . It is a microscopic phenomena due to interaction of high frequency electric field with ionic atmosphere.
The essential postulated of the Debye-Huckel theory is that every ion may be considered to be surrounded by an ionic atmosphere of opposite sign. In the vicinity of any given ion there is a predominance of ions of opposite charge (these are called counter ions). The situation is dynamic rather than static , and on the average more counter ions than like-ions pass by any given ion, and they come and go in all directions. This time averaged , spherical haze of opposite charge is called the ionic atmosphere of the ion. As long as the ionic atmosphere is “ stationary “, that is to say , it is not exposed to an applied electrical field or to a shearing force tending to cause movment of the ion with respect to the solvent , it has spherical symmetry when an ionic atmosphere is exposed to an applied electrical field, its symmetry will be disturbed . If a particular kind of ion moves to the right for example , each ion will constantly have to build up its ionic atmosphere to the right while the charge density to the left gradually decays. The rate at which the atmosphere to the right forms and that to the left dies away is expressed in terms of a quantity called the time of relaxation of ionic atmosphere. If the oscillation frequency of an applied field is higher than the reciprocal of the relaxation time , the ion will be virtually satationary and the ionic atmosphere will be symmetrical. Therefore , the retarding force due to relaxation or the asymmetry effect will disappear , or entirely , as the frequency of the oscillations of the current is increased. At sufficiently high frequencies above the reciprocal of relaxation time, the conductance of the solution should be greater than that observed with low frequency. Debye-Falkenhagen have shown that this relaxation time , θ ,is given by
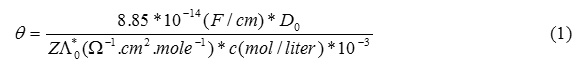
Do= dielectric constant of mater
A*0=equivalent conductivity of the solution
C= concentration of the solution
Z= # of valence

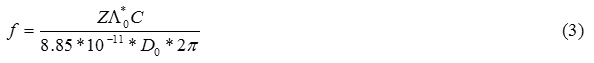
ƒλ=v(speed of light) →λ = v/f (4)
Substituting (3) in (4) we obtain
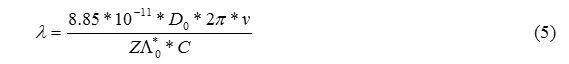
λ*C*Z=constant
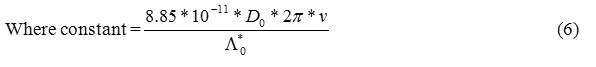
Forman and Crisp in 1946 used a capacitive cell and performed some experiments on several binary electrolytes.
The method they employed was to determine the temperature rise of a solution held in a quartz calorimeter within the condenser field of a high frequency oscillator. It was found impossible to make reliable measurements on one particular solution concentration with several different frequencies, owing to variations in the power output of the oscillator when the frequency of oscillation was varied. Therefore , the frequency and power output of the oscillator were held constant and the concentrations of the solution were varied. The temperature rise for constant time of power absorption at a constant input voltage was determined and a family of curves was
obtained. The frequency corresponding to the maximum power loss was a function of the concentration of the solution and the valence number of binary electrolyte ions. A convenient empirical relation was evaluated to be
λ*C*Z=constant 7
Which was analogous to eq.(6). Therefore , they concluded that this was an experimental proof of the Debye-Falkenhagen effect. In 1954 Reilley studied this type of cell . He proposed a circuit model for the capacitive cell and from that circuit model for the capacitive cell and from that circuit model he derived an equation analogous to eq.(5). This derivation of Reilley is done Macroscapically. Let’s not forget even though the , macroscopically , result of derivation from circuit model is identical to the result of the derivation by ionic atmosphere, microscopically , this result is the equation (7) which is famous to Debye-Falkenhagen effect. Reilley believed that this was a fortuitous concidence , and the experimental proof of Forman etal for the Debye-Falkenhagen effect was under considerable doubt. In 1962 Ermakov and Zagorets measured conductance of several binary electrolytes. In their measurements , they kept the frequency constant and the concentration of the solution was varied. They found maximum conductance at a specific concentration. The relation between concentration and frequency was similar to eq.(6). They concluded that the position of maximum is determined by the relaxation phenomena in solutions. Ermakov’s conclusion is in contradiction to Reilley’s conclusion. Now the question that needs to be addressed is who is right. In an experimental attempt to verify the Debye-Falkenhagen effect, a capacitor cell was used .Using this cell detailed theoretical and experimental investigation of Debye-Falkenhagen effect an Spectrum Analyzer was studied by us .Consequently , the overall circuit response of this type of cell, which was studied incompletely or misunderstood , was clarified. It was concluded that the Debye-Falkenhagen is a microscopic phenomenon arising from ionic atmosphere relaxation and what is observed in capacitive cell is a macroscopic phenomenon and Reilley’s belief is correct that it is fortuitous coincidence that the renspose of capacitive cell is similar to Debye-Falkenhagen relation.
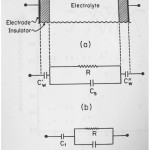 |
Fig.1 (a) Different layers of a capacitive cell. Fig.1 (b) Circuit diagram of capacitive cell. Fig. 1( c)he simplified circuit diagram of the cell. Click here to View figure |
In this section we derive that conductance of a capacitive cell and the tools of trade were described in a paper about application of circuits in chemistry , it is published in 2012 Asian Journal of chemistry . Fig 1.(a) demonstrates the layers of a capacitive type of cell.Fig.1 (b) shows the circuit corresponding capacitive type of cell.Fig.1(c) is the simplified circuit diagram of the cell . The total impedance of the circuit is
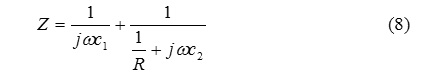
Where ω is the angular frequency of the field. After the necessary transformation , the admittance which is the inverse of the impedance can be obtained
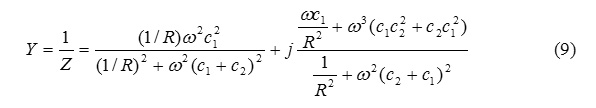
Y=G+jB (10)
Where Y is the total admittance of the circuit , G is the conductance term which is the real part of the admittance. The term 1 / R in eq.(9) can be substituted by k which is the conductance of the solution , then the total circuit conductance is given by
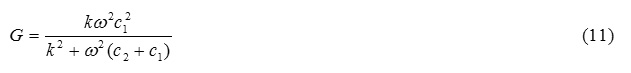
For the cell was used by us in ref.17 c1 << c2 and c2 = 1 PF, c1 0.1 PF and k varies between 10 -3 Ω-1 to 10 -6 Ω-1 and ω varies between 0.5 MHz to 25MHz.
The conductance of the cell G eq.(11) as a function of ω and k is plotted three dimensionally in fig.2 for the first time.
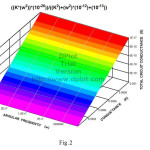 |
Fig.2 Three dimensional plot of total circuit conductance of the capacitive cell, G, as a function of conductance of electrolyte , k, and angular frequency of the electric signal , ω,. Click here to View figure |
Conclusion
Recently we have published four manuscripts 17-20 on radio frequency conductometry of electrolytes theoretically and experimentally.
This work is continuation of our previous work.In present work the focus is radio frequency conductometry of capacitive cell or contactless conductivity detector. Capacitive cell high frequency conductometry has two era, classical and modern. Classical era started with the work of Blake¹ the originator of the field. This era include the work of Russian scientists like Ermakov etal . In the classical era some scientists claim that what they see in capacitive cell in high frequency conductometry is a microscopic phenomena called Debye-Falkenhagen effect but they were corrected by Delahay². Our theoretical and experimental work using a Spectrum Analyzer support Delahay².It is interesting observation that Reilley in his work in capacitive cell interprets his result as observing Debye-Falkenhagen effect.
His work² is published in Analytical Chemistry 1953. The same paper becomes a chapter in Delahay book New Instrumental Methods in Electrochemistry². But it must be suggested by Delahay to Reilley that in the chapter contributed by the Reilley, he corrects the Analytical Chemistry paper and says the result we obtain is not due to microscopic phenomena Debye-Falkenhagen effect and what we observe is a fortuitous coincidence. Even though Delahay² in his book in 1954 corrected the result obtained for capacitive Cell. But Ermakov etal . a Russian scientist again interpret his result for the conductometry for capacitive cell as Debye-Falkenhagen a microscopic phenomena. This controversy made us to do high frequency conductomety of capacitive cell using a modern Hp Spectrum Analyzer . Our work confirmed the opinion of Delahay². In the classical era we see controversy , that we hope it is resolved by us 17.
In the modern era several scientists have tried to use the contactless detector for Capillary Zone Electrophoresis (CZF). The focus of their work has been finding a suitable electronic amplifier.
Present work discusses the Debye-Falkenhagen and develops a circuit model for conductometry of the capacitive cell. The conductance of the whole circuit of the capacitive cell is plotted as a function of conductance of electrolyte and angular frequency of the signal.
Fig.2 according to eq.(11) demonstrates the total circuit conductance of electrolyte , G, as a function of conductance of electrolyte,k, and angular frequency ,ω,. It shows G is directly proportional with k.
It suggests G the total conductance of the capacitive cell is increasing with increase in electrolye conductivity ,k,. Fig.2 also shows in a range of radio frequencies , ω, the wall of capacitive cell are transparent and G is proportional to conductivity of electrolyte and it is independent of radio frequency , ω,.
This plot is drawn three dimensionally for the first time. The Fig.2 obtained is interpreted. This work benefits both groups those who work classic and modern.
References
- G.G.Blake, J.Roy. Soc. Arts., 82,154(1933).
- C.N. Reilley , in “New Instrumental Methods in Electrochemistry ,” P. Delahay (Ed.), Wiley Interscience Publication (1954) P.319;C.N. Reilley and W.H. McCurdy, Jr., Anal. Chem., 25,89(1953).
- V.I.Ermakov , Zhur . Fiz. Khim.,34,2258 (1960)[Russ. J.phys. chem.., 1072(1960)].
- V.I. Ermakov and P.A. Zagorets , Zhur. Fiz. Khim. , 361632(1962)[Russ. J.phys. chem.., 881(1962)].
- V.I. Frmakov and P.A. Zagoraels , Zhur. Fiz. Khim., 37, 184(1962) [Russ. J.phys. chem., 881(1963)].
- J. Forman and T. Crisp. Trans. Faraday Soc., 42 A, 189 (1946).
- J.Jorgenson , K.D. Lukacs , Anal . Chem. , 53,1298, (1981).
- B. Gas, M. Demjaninko, J. Vacik. J. Chromatogr. 192,253 (1980).
- J. Vacik, J. Zuzka, I. Musilova , J. Chromatogr. 320 , 233 (1985).
- J. A. Fracassi da Silva, C. Do lago , Anal. Chem. 70 , 4339 (1998).
- K. Mayrhofer , A. J. Zemann, E. Schnell, G. K. Bonn, Analy. Chem. 71,3828(1990).
- D. Kaniansky, V zelenska, M. Masar, F. Ivanyi, S. Gazdikova, J. Chromatogr. A844,349 (1999).
- S. Polesello , S.M. Valsecchi, J. Chromatogr. A834, 103 (1999).
- D. Kaniansky, M. Masar, J. Marak, R. Boder , J. Chromatogr. A834,133 (1999).
- M. Masar, R. Boder, D. Kaniansky, J. Chromatogr. A 834, 179 (1999).
- H. Falkenhagen , “Electrolytes , “ Clarendon press, Oford (1934).
- K. Ghowsi and R.J. Gale , J. Electrochem . Soc. ,139,280(1989).
- K. Ghowsi and H. Ghowsi , Asian J. Chem.,24,4898 (2012).
- K.Ghowsi , A. Daghighi and H. Ghowsi , Asian J. Chem., 22, 4477(2010).
- A. Daghighi, K. Ghowsi and M.R. Nilforoushan, J.Sol. Chem. ,39,959 (2010).

This work is licensed under a Creative Commons Attribution 4.0 International License.
![]()
A New Edition of Web of Science
Journal Impact Factor
2022: 0.5
Five Year: 0.8
Journal is Indexed in

Cabells Whitelist
![]()


