Spectroscopic and Chemometric Analysis of Illegally Manufactured Formulations of Selected Medicines
Safwan M. Obeidat* and Ban Al-Tayyem
Department of Chemistry, Yarmouk University, Irbid (Jordan).
In this study, three common drugs (Cipram®, Panadol extra ®, Xenical®) were investigated. The study involved analyzing the above drugs using the portable NIR spectroscopy. Ten adulterated tablets of each of the above drugs were tested along with ten genuine tablets and other ten placebo tablets which represents another adulterated source for all drugs. Chemometrical Algorithms like Principal Components Analysis (PCA) and Cluster Analysis (CA) were used to extract the useful information from the collected data. Differentiating among original and the counterfeit drugs was successfully demonstrated with no chemical pretreatment. Identifying adulteration source was also possible using the above algorithms.
KEYWORDS:Potable NIRS; Counterfeit Drugs; PCA; CA; Medicines
Download this article as:| Copy the following to cite this article: Obeidat S. M, Al-Tayyem B. Spectroscopic and Chemometric Analysis of Illegally Manufactured Formulations of Selected Medicines. Orient J Chem 2012;28(2). |
| Copy the following to cite this URL: Obeidat S. M, Al-Tayyem B. Spectroscopic and Chemometric Analysis of Illegally Manufactured Formulations of Selected Medicines. Available from: http://www.orientjchem.org/?p=23418 |
Introduction
According to the World Health Organization (WHO) the problem of counterfeit medicines was first addressed at the international level in 1985 at the Conference of Experts on the Rational Use of Drugs in Nairobi. The WHO has identified counterfeit medicine as “the medicine which is deliberately fraudulently mislabeled, with respect to its identity and/or source. This includes products with correct or wrong ingredients, without active ingredients or with insufficient active ingredients.1
The problem of counterfeit medicines has recently increased because of many reasons (i.e. financial gain, minimal penalties, demand, cheap access to digital technology, etc…). The counterfeiting drugs can cause serious health problems such as diseases, dissatisfaction and in some cases they might cause death.2,3 On the other side, the reputation and the profits of the manufacturer are badly affected by adulterating a particular brand name. The Jordanian market as any drug market around the world is subjected to the drug adulteration problems. According to the Jordanian Food and Drug Administration (JFDA), several drugs are being adulterated. Many adulterated drugs are being captured in the Jordanian market. These drugs are ranging between several categories (antidepressant, pain relievers, inhibitors and others). The list of counterfeit drugs in Jordan includes expensive drugs as well as shelf drugs such as common pain killers. The current standard method of detecting the counterfeit drugs involves chromatographic techniques. However, these methods suffer from several drawbacks. Most of the uncovering the adulteration studies focused on both drugs Viagra and Cialis. For this purpose XRD, Raman spectroscopy, NIR, FT-IR, DOSY 1HNMR and other analytical methods were reported in literature for detecting the illegally manufactured drugs especially Viagra and Cialis 4-11. In this study Cipram®, Panadol extra®, Xenical® will be investigated. Table 1 shows the active ingredient and indications for each drug.
Table 1: Some details about the studied medications in the current work.
| Medicaton | ActiveIngredient | Indication | Producer |
| Cipram | Citalopram | Treating several depressions | Lundbeck
|
| Panadol extra | Paracetamol+
Caffeine
|
Used as Pain relievers and temperature reduces | GlaxoSmithKline Consumer Healthcare
|
| Xenical | Orlistat
|
Treat obesity in people with certain risk factors such as diabetes | Hoffman-La Roche Pharmaceuticals Company
|
The aim of the current study is to obtain a rapid and a reliable method for detecting illegally formulated drugs using portable NIR with no sample preparation. The NIR is well known for its powerful in providing too many details in the spectra. However, the new portable NIR instrument is less sensitive compared to the bench top NIR instrument. To extract the maximum useful information from the NIR data Principal Component Analysis (PCA) and Cluster Analysis (CA) were employed. Tracking the adulteration source was also a major goal in his study. For this purpose placebo samples were used to simulate another adulterated drug in composition in the three studied drugs. The choice of placebo to represent another adulterated drug is that most adulterated drugs caught in Jordan were with no active ingredients. Hence the composition of the adulterated drug could be very close in composition to the placebo. The placebo samples were investigated in the same way as the rest of drug samples.
Experimental
Samples collection
In this study counterfeit samples of Cipram, Panadol extra and Xenical (all in tablet form) were studied. Ten counterfeit tablets from each drug above were donated by the Jordanian Food and Drug Administration (JFDA). A similar number of the original samples were donated or purchased from the exclusive importers in Jordan. Placebo tablets were donated by Jordanian Pharmaceutical Manufacturing (JPM) Company. Ten tablets of placebo were also used for each drug. All samples including the adulterated, original and placebo were used without any pretreatment.
Portable Near-infrared (NIR) spectroscopy
The Polychromix PHAZIR is the first of its kind handheld NIR material analyzer. The light source is a tungsten lamp and the detector is a PbS solid-state detector.
Measurements and software
All samples (counterfeit, original and placebo) for each drug were first measured by the portable NIRS. The scan covered the range (1000 to 2400) nm (about 8 nm increments). The spectrum of each tablet was an average of three scans. MATLAB 7.0.4. (MathWorks, MA, USA) with PLS Toolbox 4.0 (Eigenvector Research, Inc, WA and USA) were used for the data processing and analysis. All recoded spectra were background and blank corrected. Hence, three separate data files were constructed correspond to the three studied drugs. Each file contains the NIR spectral data for all drug samples including (original, counterfeit and placebo). PCA and CA techniques were applied to the above files. The goal of this step is to differentiate among the spectra for the original and the counterfeit drugs.
Principle Component Analysis (PCA)
The PCA is an unsupervised pattern recognition technique based on calculating the eigenvectors in a data set. PCA uses orthogonal transformation to convert a number of measurements for variables that might be correlated into a set of linearly uncorrelated variables. In summary PCA that is used for finding similarities and differences among the samples in a given data set. Usually, the first few PCs express the maximum variation within a dataset. The number of principal components equals to the number of variables. In PCA the score plot is used to display similarities and differences among the objects in a data set. Samples that have similar composition and hence similar spectra will form an independent cluster. The distances between the clusters in the PCA model reflect the degree of similarity of difference.12-14
Cluster Analysis (CA)
To understand the patterns exist in a given data set and to identify similar samples the CA is used. Cluster analysis (CA) is a classification technique that is used to classify the objects of a data set into clusters. The distances (Hierarchical) between the objects in the multidimensional space are calculated. Objects of minimum distances (largest similarity) are merged in a single cluster. This approach is repeated. The distances between all pairs of clusters are also calculated. The final results including objects and clusters distances are represented by a tree like diagram called dendrogram. In the dendreogram, objects fall in one cluster are believed to have to same origin or have similar composition.15,16
Results and Discussion
Every drug formulation has a unique spectral fingerprint that identifies the brand of the drug. Incorrect formulations containing foreign or substitute ingredients can put the patient’s life under risk. The NIR spectra recorded for the Cipram, Panadol extra and Xenical (counterfeit, original and placebo) were displayed. Figure 1 (A, B and C) represents the NIR spectra for the above drugs in all cases, respectively. It is obvious that the eye balling for the spectra seems to be inefficient for differentiating original and counterfeit drugs. This might due to the low sensitivity of the spectrometer (only 100 wavelengths). Hence, to compare the entire spectra chemometrical techniques (PCA, CA) were used to detect fine differences in the spectra. In PCA case the first few PCs were used because they carry the maximum variation in all data sets. Therefore, a PCA model was created for each drug. Figure 2, displays the PCA score plot for the Cipram samples. The best view for the PCA plot was when using the second and the third PCs. In Figure 2, three independent groups of samples (clusters) can be recognized. Each one of the three groups of samples represents one form of the drug (counterfeit, original and placebo). In predicting PCA score plots, samples that form a cluster are believed to belong to the same origin. Moreover, as it can be noticed in Figure 2 the object variance observed in the counterfeit samples is greater than that in the original and placebo clusters. This might due to the poor mixing process used by the counterfeiters resulted in inhomogeneous drug formulation. Figure 3, represents the PCA score plot for the Xenical samples. Again, the best PCA plot was created using the first two PCs. In Figure 3, three separate clusters were also observed in this drug. Each cluster represents one form of the Xenical (original, counterfeit and placebo). The same results were obtained upon applying the PCA on the NIR spectra of the Panadol extra (figure not shown). These results demonstrate the powerful of the NIR and PCA in detecting counterfeit drugs. Not only that, but it also can differentiate counterfeit drugs from different origins (placebo and counterfeit). For further investigations, cluster analysis such as K- nearest neighbor (KNN) was also used. In KNN distances among all samples are calculated. The KNN dendrograms obtained for the Cipram is illustrated in Figure 4. As it can be seen in this figure, three separate groups in the dendrograms were recognized. Each group contains the samples of one form of the drug (original, counterfeit and placebo). Similar results were obtained upon applying the KNN in case of both Panadol extra (Figure 5) and Xenical (figure not shown). As indicated in the dendrogams the distinguished groups are the counterfeit, original and placebo with no interference between samples. Once more, the current technique using the portable NIR and PCA or KNN could differentiate among original and counterfeit tablets efficiently from different counterfeiters.
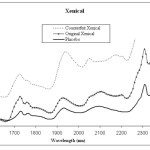 |
Figure 1A: NIR spectra obtained for Xeincal (counterfeit, original and placebo) |
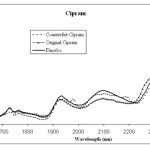 |
Figure 1B: NIR spectra obtained for Cipram (counterfeit, original and placebo) |
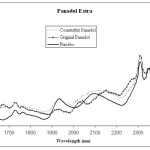 |
Figure 1C: NIR spectra obtained for Panadol Extra (counterfeit, original and placebo) |
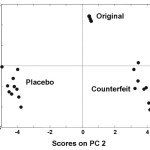 |
Figure 2: PCA score plot for the Cipram samples.
|
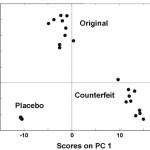 |
Figure 3: PCA score plot for the Xenical samples.
|
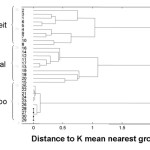 |
Figure 4: The dendrogram for the NIR spectral data recorded for all Cipram samples.
|
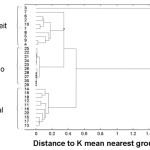 |
Figure 5: The dendrogram for the NIR spectral data recorded for all Panadol extra samples. |
Conclusion
The portable NIR spectrometer was used in this paper for detecting counterfeit drugs. The tested drugs were Cipram, Xenical and Panaol extra. The detection of counterfeit drugs was successfully achieved by applying PCA and KNN to the collected NIR data for all drugs. Were in both cases (PCA and KNN) three independent groups or clusters were clearly identified for each drug. These clusters correspond for the original, counterfeit and placebo samples in each medicine. The placebo samples were used in this study to simulate another adulteration source. This result suggests a method for tracking illegally formulated by source is possible.
References
- WHO, Counterfeit Drugs: Guidelines for the Development of Measures to Combat Counterfeit Drugs, WHO, Geneva, 1999.
- S. Henrique, F. Scafi and C. Pasquini, Identification of counterfeit drugs using near-infrared spectroscopy, Analyst, 126 (2001) 2218–2224
- European Commission, Preparation of a legislative proposal to combat counterfeit medicines for human use, summary of responses to the public consultation document, Brüssel, 2008.
- J. K. Maurin, F. Plucinski, A. P. Mazurek and Z. Fijalek ,The usefulness of simple X-ray powder diffraction analysis for counterfeit control – The Viagra example, J. Pharm. Biomed. Anal. 43 (2007) 1514-1518.
- M. de Veij, A. Deneckere, P. Vandenabeele, D. de Kaste and L. Moens, Detection of counterfeit Viagra with Raman spectroscopy, J. Pharm. Biomed. Anal. 46 (2008) 303-309.
- M. J. Vredenbregt, L. Blok-Tip, R. Hoogerbrugge, D. M Barends and D.de Kaste, screening suspected counterfeit Viagra® and imitation of Viagra® with near-infrared spectroscopy, J. Pharm. Biomed. Anal. 40 (2006) 840-849.
- S. Trefi, C. Routaboul, S. Hamieh, V. Gilard, M. Malet-Martino and R. Martino, Analysis of illegally manufactured formulations of Tadalafil Cialis® by 1HNMR, 2D DOSY 1HNMR and Raman spectroscopy, J. Pharm. Biomed. Anal. 47 (2008) 103-113.
- B. J. Venhuis, G. Zomer, M. J. Vredenbregt and D. de Kaste, The identification of (-)-trans-tadalafil, tadalafil, and sildenafil in counterfeit Cialis® and the optical purity of tadalafil stereoisomers, J. Pharm. Biomed. Anal. 51(2010) 723-727.
- P. Y. Sacré, E. Deconinck, T. De Beer, P. Courselle, R. Vancauwenberghe, P. Chiap, J. Crommen and J. O. De Beer, Comparison and combination of spectroscopic techniques for the detection of counterfeit medicines, J. Pharm. Biomed. Anal. 53 (2010) 445-453.
- S. Assi, R. A. Watt and A. C. Moffat, Identification of counterfeit medicines from the internet and world market using near-infrared spectroscopy, Anal. Meth. 3 (2011) 2231-2236.
- Y. Roggo, P. Chalus, L. Maurer, C. Lema-Martinez, A. Edmind, N Jent, A review of near infrared spectroscopy and chemometrics in pharmaceutical technologies, J. Pharm. Biomed. Anal. 44 (2007) 683-700.
- S. Wold, K. Esbensen, P. Geladi, Principal component analysis, Chemomet. Intell. Lab. Syst. 2 (1987) 37–52.
- K. Šnuderl, M. Simonič, J. Mocak and D. Brodnjak-Vončina Multivariate data analysis of natural mineral waters, Acta chim. Slov. 54 (2007) 33-39.
- K.H. Esbensen, Multivariate Data Analysis – In Practice, 4th ed.,CAMO, 2000.
- A. F. M. Alkarahi, A. Ahmad and A. Mat Easa, Assessment of surface watrer quality of selected estuaries of Malaysia: multivariate statistical techniques, Environmentalist, 29 (2009) 255-262.
- B. M. Wise, N. B. Gallagher, R. Bro, and J. Shaver, PLS_Toolbox 3.5 (Eigenvector Research, Inc., 2006).

This work is licensed under a Creative Commons Attribution 4.0 International License.
![]()
A New Edition of Web of Science
Journal Impact Factor
2022: 0.5
Five Year: 0.8
Journal is Indexed in

Cabells Whitelist
![]()


