A New Extractive Spectrophotometric Method for the Determination of Gatifloxacin and Cefotaxime Sodium in Pure and Pharmaceutical Dosage Forms
Download this article as:
![]()
Simple, accurate, precise, and rapid extractive spectrophotometric method was developed for the estimation of gatifloxacin (I) and cefotaxime sodium (II) in both pure and pharmaceutical dosage forms. The method was based on the formation of colored complex by the drugs with Eriochrome black-T in an acidic medium. The ion-associated complex formed was quantitatively extracted under the experimental conditions with methylene chloride and the absorbances of the organic layers were measured at 510 nm. Beer’s law was obeyed in the concentration range of (3- 18) and (30-120) ìg.ml-1 for drug (I) and (II) respectively .The correlation coefficient (r2) for the studied drugs was found to be 0.9999. The molar absorptivity (µ), sandell sensitivity, detection (LOD) and quantitation limits (LOQ) were also calculated. The proposed method was successfully applied for the determination of certain pharmaceutical dosage forms containing the studied drugs.
KEYWORDS:Gatifloxacin and Cefotaxime Sodium; Extractive Spectrophotometric; Ion Pair Complexation; Eriochrome black-T
Introduction
Gatifloxacin chemically (±)-1-Cyclopropyl-6-fluoro-1,4-dihydro-8-methoxy-7-(3-methyl-1-piperazinyl)-4-oxo-3-quinolinecarboxylic acid [1], is a fourth-generation synthetic broad-spectrum 8-methoxy fluoroquinolone antibacterial drug derivative [1]. Gatifloxacin offers several advantages over previous-generation antibiotics. It has enhanced in vitro activity against clinically important pathogens and resistant strains (especially penicillin-resistant Streptococcus pneumoniae), with better pharmacokinetics. Gatifloxacin is indicated for the treatment of acute bacterial exacerbation of chronic bronchitis, acute sinusitis, community- acquired pneumonia, uncomplicated urinary tract infections (cystitis) and complicated urinary tract infections [2] .
A literature survey revealed that gatifloxacin has been estimated in plasma by non-aqueous titration using perchloric acid [3], chromatographic [4-9], spectrofluorimetric [10], capillary ectrochromatography [11], electrochemical [12] and spectrophotometric [13-20] methods.
Cefotaxime sodium chemically (6R, 7R)-3-[(acetyloxy) methyl]-7-[[(2Z)-2-(2-aminothiazol-4-yl)-2-(methoxyimino)acetyl]amino]-8-oxo-5-thia-1-azabicyclo [4.2.0] oct-2-ene-2-carboxylate [1], is a third generation cephalosporin, a broad antibacterial spectrum and is resistant to β-lactamases [1]. Cephalosporins are distributed widely into tissues and body fluids, including pleural, pericardial, and synovial fluids. However, while the earlier cephalosporins failed to penetrate the central nervous system and were unsuccessful in the treatment of meningitis, the third-generation cephalosporins enter the central nervous system and reach therapeutic concentrations, they were used for treatment of meningitis caused by aerobic gram-negative bacteria [21]. cefotaxime sodium and its injection are official in BP 2007 [22] which HPLC methods with UV detection is reported for them. Many spectrophotometric methods were reported for cefotaxime sodium determination [23-29].Also,adsorptive stripping voltammetry [30] and potentiometric [31] methods were applied for its determination. Other reported techniques include infra-red spectroscopy [32] and capillary zone electrophoresis [33].
Eriochrome Black T (EBT) is ,known as mordant black, is an azo dye, 3-hydroxy-4-[(1-hydroxy-2-naphthalenyl)azo]-7-nitro-1-naphthylene sulfonic acid mono sodium salt that is used as a complexometric indicator in complexometric titrations ,e.g. in determining the hardness of water. It was used for the determination of erythromycin [34], promethazine HCl [35], nifedipine [36], enorfloxacin, lomefloxacin, ofloxacin [37], drotaverine Hydrochloride [38] diphenhydramine hydrochloride [39] and tramadol Hydrochloride [40] .
In this paper we report a new, simple, sensitive and inexpensive method for the estimation of gatifloxacin (I) and cefotaxime sodium (II) in both pure and pharmaceutical dosage forms. The method was based on the formation of colored complex by the drugs with Eriochrome black-T in an acidic medium. The ion-associated complex formed was quantitatively extracted under the experimental conditions with methylene chloride followed by spectrophotometric determination at 510 nm.
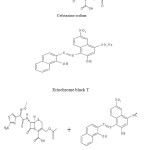 |
Scheme 1 Click here to View scheme |
Experimental
Apparatus
shimadzu recording spectrophotometer UV 1201 equipped with 10 mm matched quartz cells.
Digital analyzer pH meter (USA) was used.
Materials and reagents
Chemicals of analytical grade and double distilled water were used throughout the work.
1-Gatifloxacin,gatilox ® eye drops labelled to contain 0.3% gatifloxacin (5 ml ophthalmic solution) (The Nile Co. for Pharm. And Chem.Ind.) for The EGYPTIAN Co. for PHARMACEUTICAL and CHEMICAL INDUSTRIES (EPCI),S.A.E.
2- cefotaxime sodium, cefotax® vials labelled to contain 1000 mg cefotaxime sodium per vial ( EGYPTIAN INT. PHARMACEUTICAL INDUSTRIES CO. E.P.I.C.O. Egypt)
3-Eriochrome black T (EBT) was obtained from Fine LTD ( India) ,0.5 % (w/v), 2.5 ×10 -3 M and 5×10 -4 M solutions dissolved in least amount of methanol and completed to volume with water.
4- Acetic Acid was obtained from El-Nasr Chemical Company, (Egypt).
Standard Drug solutions
1- Preparation of gatifloxacin standard solutions: Stock solution was prepared to contain 0.2 mg/ml, by dissolving10 mg of the pure drug in least amount of 50% acetic acid and completed to 50 ml with distilled water.
2-Preparation of cefotaxime sodium standard solutions: Stock solution was prepared to contain 2 mg/ml by dissolving 100 mg of the pure drug in 50 ml double distilled water.
General procedure
Different aliquots of standard solutions containing (0.03 – 0.18) and (0.3 -1.2) mg of (I) and (II) were pipetted into series of 60 ml separating funnels and specific volumes of 5 M acetic acid and EBT were added for the studied drugs by the proper sequence for each drug (Table 1). The solutions were vigorously shaked .The formed ion pairs were extracted with 3 × 3 ml methylene chloride and the separated organic layer dried over anhydrous sodium sulphate and transferred into 10 ml volumetric flasks. The volumes were completed to 10 ml with methylene chloride. The absorbances of the colored solutions were measured at 510 nm against reagent blank treated similarly.
Procedure for pharmaceutical formulations
For gatilox eye drops Accurate volume of gatilox eye drops equivalent to 10 mg of gatifloxacin were measured, completed to 50 ml with double distilled water and the procedure was completed as under general procedure
For cefotax vial Accurate volume of cefotax vial equivalent to 100 mg of cefotaxime sodium was measured, completed to 50 ml with double distilled water and the procedure was completed as under general procedure
Stoichiometric relationship
Job’s method of continuous variations [41] was employed using equimolar ( 5×10 -4M and 2.5 ×10 -3 M) standard solutions of gatifloxacin and cefotaxime sodium with Eriochrome black T (EBT) ( 5×10 -4M and 2.5 ×10 -3 M) . A series of solutions were prepared in which the total volume of drugs and Eriochrome black T (EBT) was kept at 3 mL then the procedure was completed as under the above mentioned procedure.
Results and Discussion
The studied drugs have amino groups which are protonated in acidic medium and form with Eriochrome
black T (EBT) ion-pair complexes, forming a red chromophore . The ion-pair complexes were quantitatively extracted with methylene chloride.The absorption spectra were shown in (Fig. 1) which revealed that the ion-pair complexes absorbed maximally at 510 nm. Several parameters such as acidity, type and amount of acid added, reagent volume, sequence of addition and effect of extracting solvent were optimized to achieve high sensitivity, stability, low blank reading and reproducible results.
Effect of acidity
In a trial to elucidate the optimum medium for the quantitative determination of the studied drugs the effect of different buffers and acids such as nitric, acetic and hydrochloric acids was examined. The highest absorbance values and highest stability were obtained in the presence of 0.2 and 2 ml of 5 M acetic acid for (I) and (II) respectively (Fig 2 and 3).
Effect of reagent concentration
The effect of reagent concentration was tested by using varying concentrations (0.2 – 0.9) % (w/v) solutions of Eriochrome black T (EBT). The most favourable concentration was 0.5 % (w/v) for both drugs for the production of the highest colour intensity and to obtain maximum absorbance .( Fig.4).
Effect of the reagent volume
The effect of reagent volume was tested by using varying amounts (0.1–1) ml of 0.5 % (w/v) solution of Eriochrome black T (EBT) The results showed that 0.5 ml of EBT was sufficient for the production of maximum and reproducible colour intensity for both drugs.(Fig.5).
Effect of sequence of addition
The most favourable sequence was reagent– drug–acid for (I) and reagent–acid- drug for (II) for the production of the highest colour intensity, while the other sequences produce lower absorbance values.
Effect of the extraction time
Shaking the reaction mixture with the extracting organic solvent is required for complete extraction of the ion-pair formed between the drug and the dye. It was found that 30 seconds is enough time for complete colour extraction.when shaking time exceeds 30 seconds. It produces lower absorbance values and less stability. The obtained colour was stable for at least 30 minutes and one hour for (I), (II) respectively at room temperature (25° C ± 2) (Fig 6).
Solvent effect and number of extractions
The polarity of the solvent affects both extraction efficiency and absorbance intensity. Different types of solvents were tried (chloroform, dichloromethane, 1,2-dichloroethane, benzene, and ethyl acetate). The results obtained indicated that dichloromethane is the appropriate solvent for extraction for the studied drugs due to high sensitivity and considerably lower extraction ability of the reagent blank.
Complete extraction was attained by extraction of 3×3 ml of dichloromethane and then complete to 10 ml with the same solvent.
Effect of reaction time
Reaction time required for complete color development of ion-pair formed between the studied drugs and EBT was studied and color was found to developed immediately all cases at room temperature (25±2°C).
The stoichiometric ratio of the ion-associate
The stoichiometry of the ion-associates formed between the drugs under investigation and the reagent was investigated by applying the continuous variation [41] method at the wavelengths of maximum absorbance. The results obtained showed that the stoichiometric ratio of the ion-associates is (2:1) and (1:1) (reagent:drug) for (I), (II) respectively .(Fig. 7)
Method validation
Linearity
Under the optimum conditions described, standard calibration curves for gatifloxacin and cefotaxime sodium with EBT were constructed by plotting absorbance against concentration. Conformity with Beer’s law was evident in the concentration range of the final dilution cited in (Table 1). Beer’s law holds over the concentration ranges (3-18) and (30-120) μg.ml-1for (I) and (II) respectively. The linear regression equation for each drug was listed in (Table 1). The correlation coefficient was 0.9999 indicating good linearity over the working concentration range.
Sensitivity
The detection limit (LOD) for the proposed method was calculated using the following equation according to the ICH [42]
LOD = 3.3 σ/S
Where σ = the standard deviation of replicate blank responses (under the same conditions as for sample analysis)
S = the slope of the calibration curve
The limits of quantitation, LOQ, is defined as;
LOQ = 10 σ/S
According to the previous equations , the LODs and LOQs were calculated as in table 1.Their values confirm the sensitivity of the proposed method.
Accuracy and precision
In order to determine the accuracy and precision of the proposed methods, solutions containing one concentration of each drug was prepared and analysed in seven replicates. The relative standard deviation (RSD%) as precision and percentage relative error (Er %) as accuracy of the suggested method were calculated at 95% confidence levels, and can be considered satisfactory. The inter- and intra-day precision and accuracy results are shown in ( Table 3 and 4). The analytical results for accuracy and precision show that the methods proposed have good repeatability and reproducibility.
Analytical applications
The proposed method was applied to determine the studied drugs in their pharmaceutical dosage forms. Satisfactory results were obtained. To check the validity of the proposed method, the standard addition technique was applied by adding them to the analyzed pharmaceutical dosage forms. The recovery of each drug was calculated by comparing the concentration obtained from the spiked mixtures with those of the drug. The results of analysis of the commercial dosage forms and the recovery study as shown in (Tables 2). The results obtained were compared with the reported methods [20 and 43]. No significant differences were found between the proposed methods and reported methods. Statistical comparison of the results was performed using Student t-test
and Variance ratio F-test at 95% confidence level. (Table 5).
Conclusion
The proposed method is advantageous when compared to many of the reported spectrophotometric methods in having higher sensitivity. The data given above reveal that the proposed method is simple,accurate and sensitive with good precision and accuracy. With this method, one can do the analysis at low coast without losing accuracy. No interference from excipients was encountered .The proposed method can be used as alternative methods to the reported ones for the routine determination of gatifloxacin and cefotaxime sodium in the pure form and in pharmaceutical formulations depending upon the availability of chemicals and the equipment.
Table 1: Characteristic parameters for the reaction of studied drugs with EBT
|
Cefotaxime sodium |
Gatifloxacin |
Parameter |
|
510 |
510 |
λ max (nm) |
|
30-120 |
3-18 |
Beer’s law limits (μg.ml-1) |
|
5M HAC |
5M HAC |
Type and molarity of acid |
|
2ml
|
0.2 ml
|
Volume of acid |
|
0.5 ml
|
0.5 ml |
EBT volume
|
|
methylene chloride |
methylene chloride |
Extracting solvent |
|
Regression equation** |
||
|
0.0072 |
0.0486 |
Slope (b) |
|
0.0511 |
– 0.0418
|
Intercept (a) |
|
0.9999 |
0.9999 |
Correlation coefficient (r2) |
|
2.80 |
0.42 |
LOD μg/ml
|
|
8.49
|
1.26 |
LOQ μg/ml
|
|
0.12 |
0.02 |
Sandell sensitivity μg.cm-2 |
|
0.39 |
1.6 |
ε (×104) L.mol-1.cm-1
|
Table 2: Application of the standard addition technique to the spectrophotometric determination of the studied drugs Ι-ΙI with EBT in pharmaceutical dosage forms
|
CEFOTAX VIAL |
Gatilox eye drops |
||||||
|
Recovery %
|
Found conc. μg.ml–1
|
Authentic added μg.ml-1
|
Claimed taken μg.ml-1
|
Recovery %
|
Found conc. μg.ml -1
|
Authentic added μg.ml-1
|
Claimed taken μg.ml-1
|
|
101.81 100.63 99.97 100.81 100.90 99.19 100.33 101.68 |
30.54 20.13 39.99 50.40 60.54 69.43 80.26 91.51 |
20 40 50 60 70 80 90 |
30 5 |
100.69 101.23 100.41 100.18 100.37 99.93 101.23 |
3.02 4.05 6.02 7.01 10.04 11.99 14.17 |
4 6 7 10 12 14 |
3 |
|
100.66 |
|
Mean
|
100.58
|
|
Mean
|
||
|
0.74 |
Variance
|
0.25 |
Variance
|
||||
|
0.86 |
S.D.
|
0.50 |
S.D.
|
||||
|
0.30 |
S.E. |
0.19
|
S.E. |
||||
Table 3: The intra-day precision and accuracy data for Gatifloxacin and Cefotaxime sodium
|
Accuracy Er % c |
Precision RSD% b |
Recovery % |
Found a conc. μg.ml-1 |
Added conc. μg.ml-1
|
Drug |
|
– 0.06 |
0.38 |
99.94 |
17.99 |
18 |
Gatifloxacin |
|
– 0.67 |
0.4 |
99.33 |
99.33 |
100 |
Cefotaxime soddium |
Table 4: The inter-day precision and accuracy data for Gatifloxacin and Cefotaxime sodium
|
Accuracy Er % c |
Precision RSD% b |
Recovery % |
Found a conc. μg.ml-1 |
Added conc. μg.ml-1
|
Drug |
|
0.02 |
0.40 |
100.02 |
18.00 |
18 |
Gatifloxacin |
|
0.03 |
0.67 |
100.03 |
100.03 |
100 |
Cefotaxime soddium |


ISSN Online: 2231-5039

![]()


