Pollution Source Identification of Halda River Water Using Field Observation, Laboratory Analysis and GIS Technique
Mohammad Abdul Karim1, Mohammad Helal Uddin1, Suman Barua1* , Biswajit Nath2, Aminul Islam Chowdhury1, Md. Ashraful Hoque1 and Ismail Md. Mofizur Rahman3
1Department of Applied Chemistry and Chemical Engineering, University of Chittagong, Chittagong 4331, Bangladesh.
2Department of Geography and Environmental Studies, University of Chittagong, Chittagong 4331, Bangladesh.
3Institute of Environmental Radioactivity, Fukushima University, 1 Kanayagawa, Fukushima City, Fukushima 960-1296, Japan.
Corresponding Author E-mail: sumanjoara@cu.ac.bd
DOI : http://dx.doi.org/10.13005/ojc/350502
Article Received on : 01-09-2019
Article Accepted on : 03-10-2019
Article Published : 11 Oct 2019
Halda River (HR), the lone natural carp breeding ground in Bangladesh as well as in Southeast Asia is an economically important river and its water quality is deteriorating due to unplanned industrialization and various anthropogenic activities. The present research work has been conducted to assess the characteristics of HR water. Eighteen water quality parameters were studied including pH, temperature, Dissolved Oxygen (DO), Biological Oxygen Demand (BOD), Chemical Oxygen Demand (COD), Total Dissolved Solids, Electrical Conductivity, Hardness, Turbidity, Total Alkalinity, SO42-, PO43-, NO3-, Cl-, NH4+, Cr (VI), Mn (II) and Arsenic. This study shows that water in HR is regularly alkaline and its pH lies between 7.08-7.65. The DO value varies from 5.9-8.4 mgL-1, BOD ranged from 0.3-2.8 mgL-1 and COD from 24-96 mgL-1. According to the Water Quality Index study, the river is being intensely polluted due to the unscrupulous industrial wastes discharge into the HR through various canals.
KEYWORDS:Halda River; Pollution Sources; Water Quality Index; Water Pollution Index
Download this article as:| Copy the following to cite this article: Karim M. A, Uddin M. H, Barua S, Nath B, Chowdhury A. I, Hoque M. A, Rahman I. M. M. Pollution Source Identification of Halda River Water Using Field Observation, Laboratory Analysis and GIS Technique. Orient J Chem 2019;35(5). |
| Copy the following to cite this URL: Karim M. A, Uddin M. H, Barua S, Nath B, Chowdhury A. I, Hoque M. A, Rahman I. M. M. Pollution Source Identification of Halda River Water Using Field Observation, Laboratory Analysis and GIS Technique. Orient J Chem 2019;35(5). Available from: https://bit.ly/2NqY7uW |
Introduction
Among the 700 rivers flowing over Bangladesh, Halda is unique for carp breeding [1]. Every year fish eggs of different carps are collected from this river from April to June. Carps such as Catla catla, Labeo ruhi, Labeo calbasu, and Cirrhinus mrigala are found in this water body as this is the best place for fish spawning due to its unique turbulent property. Additionally, high tidal flow of water impedes the spawn from washing away. Halda River (HR) is about 48 km long river located from 22°24ʹ42.6ʹʹ north to 91°53ʹ22.8ʹʹ east. This large natural carp breeding river was originated from Badnatali hill range of Ramgarh upazilla with the name Halda Chora and flows over Fatikchari, Hathazari, Raozan upazilla and fall into the Karnafully River leading to the Bay of Bengal [1]. This economically important river provides a large amount of fish spawn each year, and during the year 2018 about 22,680 kilograms (kgs) of fish eggs were collected. Around 378 kgs of fish larvae could be produced from these eggs and around 400-500 thousands of fish will be found from one kilogram of larvae [2]. Apart from fish habitats, this river also plays vital roles in domestic water supply, agriculture, industry, and navigation. The HR supplies about 50% (90×106 Litre/day) treated water to the Chittagong city corporation area. Nearly 30% of the river basin inhabitants of this river are directly involved in agriculture, and irrigation by single lifting using the low lift pump for high yield variety rice cultivation during the dry season [3]. The water from this river is used for innumerable rural and urban communities and livestock, fish culture, recharge of groundwater, control of floods and so on [4].
This important river is now getting polluted intensely. Significant environmental degradations faced in the HR are river erosion, overflow, water pollution, and waterlogging. Some other threats include the degradation of fish habitat and salinity intrusion [5]. Leading causes of that degradation are discharging of wastewater, over-exploitation of fish stocks, dredging, siltation, and sluice gate. This natural fish spawning ground is polluted due to the industrial waste carried by Bamanshahi canal, Khondokia canal, Madari canal, Chengkali canal, and so many drains that carry the pollutants from industrial effluent.
Specific parameters of water must be monitored and controlled regularly to maintain the optimum condition of any aquaculture system. The best way of describing the condition of the water is through index number, i.e., Water Quality Index (WQI) and Water Pollution Index (WPI). The WQI is an index number which illustrates the overall conditions of water at a certain period or location, and it is evaluated by considering several water quality parameters [6]. It can be used as a tool of comparison of the quality of different water bodies, and it provides the public a general idea of the problems and benefits of using the water [7]. Among the various ways, the indices WQI is the most effective means to accumulate information on water quality for water quality management [7]. The WPI [8, 9] represents an arithmetical way of integrating parameters for assessing the chemical and ecological status of inland waters. This studies shows that the use of this index simplifies the evaluation of the status and that is suitable for application for different water body types. The advantage of the WPI index is that it allows combination of different parameters, in addition there is no limitation in the number or types of the used parameters. In this study eight parameters were taken into consideration for calculation.
The objective of this study is to evaluate the water quality parameters of the HR during the breeding seasons by considering WQI and WPI. Another important objective was to depict the present pollution status of the river, identify the most polluted areas and find a particular reason behind it. The unique view point of the present research is the identification of the significant contaminant sources in the HR which is not reported yet.
Materials and Methods
Sampling
This study was conducted in the HR which lies between 22°25ʹ13ʹʹN to 22°48ʹ51.37ʹʹN and 91°45ʹ00ʹʹE to 91°52ʹ33ʹʹE (Figure 1) Two important factors were emphasized, which were breeding orbital zone and intense pollution point. Industrial wastes, sewage discharge, tobacco farming, rubber dam, and sand extraction are the main sources of pollutants of the river that are carried by canals [10]. Five canals namely Bamanshahi, Mondakini, Madari, Chengkhali and Khondokia located from Nazhirhat to Baluchara area along the HR bank were selected as the main discharge routes responsible for HR Pollution. These discharge points were selected as the sample collecting point. Fifteen samples were collected from five distinct points Mondakini canal falling zone (W1) (22°37′55″N to 91°47′34″E), Chengkhali canal falling zone (W2) (22°30′7″N to 91°51′6″E), Madari canal falling zone (W3) (22°27′01″N to 91°51′36″ E), close to Modhunaghat power grid substation (W4) (22°26′04″N to 91°52′19″E) and intake point of Mohara water treatment plant (W5) (22°24′57″ N to 91°53′05″ E). The three replicates were averaged for the calculation puprose Figure 1 shows the GPS location map of the total sampling sites of the present study.
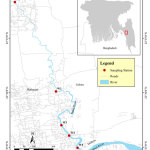 |
Figure 1: GPS map showing the sampling sites. Click here to view figure |
Measurement process
Eighteen water quality parameters were investigated, and these parameters were selected considering their importance on significance in pollution analysis. Water quality parameters such as pH, Temperature, Biochemical Oxygen Demand (BOD5), Chemical Oxygen demand (COD), Dissolved Oxygen (DO), Total Dissolved Solids (TDS), Turbidity, Conductivity, Alkalinity, Hardness, Chlorides, Phosphate, Sulfate, Chromium, Nitrate, Manganese, Arsenic, and Ammonium ion were determined. A general assumption can be assumed by these parameters. Fish spawning area has been marked from Garuduara to ModhunaGhat including Chattarghat, Najhumiaghat, Napiterkona, Ankurighona, Azimerghat, Ramdasghat, Boruapara, and Machhuraghona [11].
The water samples were collected from the selected sites from January to June 2018 and pH, DO were analyzed insitu at the sampling sites using Hanna pH meter and Hanna DO meter (DO-5509), respectively. The other parameters namely BOD5 was measured by measuring DO concentration before and after five days of incubation (Biotron 200) at 5°C, Turbidity was measured by Lovibond TB 250 turbidity meter, TDS and Conductivity by TDS meter (model: sensION5, HACH). COD, Alkalinity, Hardness, Chlorides were analyzed in the laboratory as per the standard procedures of APHA [12]. NO3–-N, PO43--P, NH4+ SO42-, Cr (VI) and Mn (II) were evaluated by using Direct Reading Spectrophotometer (DR/2000).
WQI computation
WQI is a number of calculating value evaluated by considering the several water quality parameters, and it provides a definite idea on the quality of water. Table 1 shows the possible uses and the grading of water depending on its WQI. The calculation of the WQI can be performed by using the weighted index method.
Table 1: Classification of water quality based on weighted arithmetic WQI method
|
WQI |
Status | Possible uses |
| 0-25 | Excellent |
Drinking, irrigation and industrial |
|
26-50 |
Good | Domestic, irrigation and industrial |
| 51-75 | Fair |
Irrigation and industrial |
|
76-100 |
Poor | Irrigation |
| 101-150 | Very poor |
Restricted use for irrigation |
|
Above 150 |
Unfit for Drinking |
Proper treatment required before irrigation |
Adopted from [14, 30]
The Weighted arithmetic water quality index (WQIA) is calculated by using the following equation:
![]()
Where Wi = relative weight and qi = quality rating
Horton, 1965 first introduces this Water Quality Index (WQI) by using the ten most common widely used variables like DO, pH, coliforms, specific conductance, alkalinity chlorides, etc. [13] depending on their importance which is further upgraded by Brown [14]. The most popular water quality indices such as National Sanitation Foundation Water Quality Index (NSFWQI), Weight Arithmetic Water Quality Index (WAWQI), Canadian Council of the Ministers of the Environment Water Quality Index (CCMEWQI), Oregon Water Quality Index (OWQI) has been formulated by national and international organizations [13]. Alternatively, the weighted arithmetic water quality index (WQIA) has been calculated using the following equation:
![]()
Where n is the number of variables or parameters, SIi is the water quality index of the ith parameter as shown in equation 3
![]()
In addition with the above equation (3), this qi is the water quality level based on the ith water quality parameter and qi is calculated as follows which shown in equation 4.
![]()
Where, Vi is the observed value of each water quality parameter for each water sample, and Si is the standard value for each water quality parameter suggested by WHO guidelines.
According to WHO ideal value for each parameter is considered as zero, i.e., Vid=0 except pH and DO. In that case, it represent as below shown in equation 5.
![]()
Another term relative weight was computed based on the following equation 6
![]()
Where Wi is the relative weight, and wi is the unit weight of each parameter and n is the number of parameters.
In that case, each water quality parameters was assigned a weight from a scale of 1 (lowest effect on water quality parameters) to 5 (most substantial effect on water quality parameters) based on perceived effects on primary health and according to its relative importance to the surface water environment.
As this WQI was introduced considering the use of the water body for drinking purpose; therefore, WHO (2013) guideline [15] was taken as standard method. WQI of this water body was also developed by considering its use as drinking water. Again, as it is the most significant natural carp breeding ground in Bangladesh, another study was done and that is the comparison of observed results with the standard value for contamination level indication. Table 2 shows the typical ideal value and permissible value of different water quality parameters [16-22].
Table 2: Referal standard value of important water quality parameters
|
Parameter |
Permissible value(Si) | Ideal value (Vid) |
| Temperature (°C) | 35a |
27b |
|
pH |
8.45c | 7.0c |
| DO (mgL-1) | 8.5c |
6c |
|
BOD (mgL-1) |
6g |
3c |
|
COD (mgL-1) |
50c |
20c |
|
TDS (mgL-1) |
2000c |
500c |
|
Turbidity (NTU) |
70d |
30b |
|
Alkalinity (mgL-1) |
300b | 200c |
| Hardness (mgL-1) | 150e |
20f |
|
Conductivity (µS/cm) |
5000e | 1500e |
|
Chloride (mgL-1) |
90e |
60 e |
| Ammonium ion (mgL-1) | 4g |
0.2g |
|
PO43- (mgL-1) |
0.07e |
0.06e |
a [21], b [19], c [20], d [22], e [18], f [16], g [17]
WPI computation
The modified WPI [23] was used to estimate the water quality class. The WPI is calculated as the sum of the ratio of the measured annual average value Ai and the standard threshold values T for each parameter, divided by the number of used parameters (n):
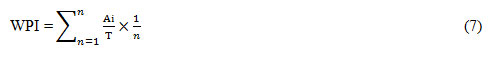
The standard threshold values for all parameters are from EQS (Environmental Quality Standards) guideline. The quality class of WPI are given in Table 3.
Table 3: Water quality classification according to WPI value
|
Ranks |
Water quality class | WPI |
|
I |
Very Pure |
≤0.3 |
| II | Pure |
0.3-1.0 |
|
III |
Moderately polluted | 1.0-2.0 |
|
IV |
Polluted |
2.0-4.0 |
|
V |
Impure |
4.0-6.0 |
| VI | Heavily Impure |
>6.0 |
Multi-parameters water quality mapping and Uncertainty
In this part, we tried to observe and generate multi-parameters based water quality (WQ) status mapping of HR based on five different sampling locations. For the entire HR status monitoring, first, we considered the HR boundary as the shape file which masked out from world river database, It was then modified and matched with the Google earth (GE) viewer and converted the KML file format into desirable shape file format for further use of mask operation. The interpolation technique of inverse distance weighted (IDW) method of spatial analyst tool box of ArcGIS 10.6 software was used to know individual parameter status. The IDW method is better to know the WQ status of the entire HR basin. To determine the entire status of HR, 14 distinct classified maps of multiple parameters and 1 for WQI map were produced by considering natural breaks (Jenks) five class method adopted during data classification stage. The classified range data values were further rounded in decimal places according to the data calculated. A similar color index gradient was applied on each final classified images starting with low values (dark red) to high values (blue).
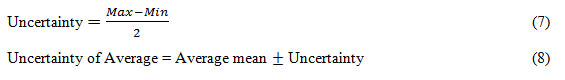
Moreover, in this study, we calculated the uncertainty of average based on the mean values of five (5) sample locations. Finally, the following formula is used to get the uncertainty of average by considering the two equations as shown in equations (7 and 8), respectively.
Results and discussion
The interpolation of average magnitude of different water quality parameters of HR using GIS mapping is shown in Figure 2 and comparison of observed values with their relative standard value is shown in Figure 3. The data depicts the change of different parameters from upstream to downstream.
Temperature is a measure of molecular vibrational energy. The temperature of the water has significant ecological consequences [24]. Temperature exerts a considerable influence on aquatic organisms concerning selection/occurrence and level of activity of the microorganisms. In general, increasing water temperature consequences in greater biological activity and more rapid growth of the organism. All aquatic organisms have preferred temperature in which they can survive and reproduce optimally [25]. The temperature of HR water during the breeding time was observed between 28°C and 29°C (Figure 3a) which is almost favourable for the activity of aquatic livings [17].
In the present study, it has been observed that HR water was regularly alkaline and its pH value lies between 7.08 and 7.65 (Figure 2a, Figure 3b). The observed pH value slightly varied that has no significant impact on fish habitat, and it was almost the same to the ideal pH value (7.4) of fish blood. Again it didn’t cross the tolerance limit suggested by EQS which is 8.5.
The most critical parameter of water is DO which has direct impacts on the growth, survival distribution, behaviour, and physiology [26]. Reducing oxygen to water leads to poor feeding of fish, starvation, reduced growth and ultimately propagation. Standard DO value for river water was suggested 6.0 -6.5 mgL-1 for fish production [20]. Present study observed the DO of HR water ranged from 5.90-8.40 mgL-1 (Figure 2b, Figure 3c). The highest DO observe at point W4 within the zone of blue color ranged 7.89-8.40 mgL-1 and lowest at W2 within the range of 5.90-6.22 mgL-1 (Figure 2b, Figure 3c). However, the DO value decreases due to the intrusion of salt water during high tide, also the period indicate monsoon which help to increasing of temperature and considered as a factor for changing of DO.
BOD is the measurement of dissolved oxygen consumed by microorganism for the degradation of organic matter. The BOD value in the HR in different spots ranged from 0.3-2.8 mgL-1 (Figure 2c, Figure 3d). According to Bhatnagar et al.,[20] this BOD value lies close to the ideal value for fish growing and it confirms the suitability of fish breeding.
COD is an essential parameter in water pollution analysis. It is closely related to the organic contamination of water or wastewater sample. Average COD value found in HR is 54.1 mgL-1. The highest COD value (84.1-96.0 mgL-1) obtained for the sample collected from the Madari canal falling zone (W3) (Figure 2d, Figure 3e). The above high class value of COD indicates the higher microbial activities in the river and the breaking down of organic-inorganic material entering the river incessantly [27].
Moreover, the addition of lime, calcareous materials, and fertilizer through leaching of agricultural land, alkaline waste from industries may raise the alkalinity of water. During the rainy season, the concentration of alkaline materials increase and alkalinity is essential for fish and aquatic organisms because it quickly protects or act as buffers against pH. Moyle described in his research, the range of total alkalinity for low production between 0.0-2.0 mgL-1, alkalinity between 20.0-40.0 mgL-1 is suitable for low to medium production, 40.0- 90.0 mgL-1 is suitable for medium to high production rate and above 90 mgL-1 is suitable for high production rate [28]. In the present study, HR water alkalinity has been found between 32.5-90 mgL-1 (Figure 2e, Figure 3i) which is moderately perfect for fish spawning or breeding.
The measurement of Hardness assumed the amount of Calcium and Magnesium earth metals in water. The hardness is usually expressed as calcium carbonate-equivalent milligram per liter, water considered as soft containing 60 mg of calcium carbonate per liter. Present Study depicts that Hardness varied from 50-100 mgL-1 in HR (Figure 2f, Figure 3j) which is similar to the value described by Stone and Thomforde [18].
Conductivity is a measurement used to determine the number of applications related to water quality. Such as mineralization, noting variation or changes in natural water and wastewater quickly; estimating the sample size necessary for other chemical analysis, and determining amounts of chemical reagents or treatment chemicals to be added to a water sample. Conductivity is the alternative indication of TDS, and that is the measurement of the ion content and freshness of water. In most of the cases conductivity has been found as twice as TDS. The permissible value of conductivity is 5000 µScm-1, and the ideal value is 1500 µScm-1 [18]. The observed conductivity ranged from 96.1-218 µScm-1 (Figure 2g, Figure 3h) which lies in below of both ideal and permissible value. TDS value was also near about its typical value, and it ranged from 45.5-104.1 mgL-1 observed in this study (Figure 2h, Figure 3g). The permissible TDS value is 2000 mgL-1 and ideal value is 500 mgL-1. This range of TDS value doesn’t lower the rate of fish breeding [20]. The Turbidity value was observed highest range (117.3-130.0 (NTU) in the lower downstream region shown in blue color (Figure 2i, Figure 3f).
Almost all phosphorus is present in the form of phosphate and mainly bound in living or dead organisms and particulate matter in surface water. According to Stone and Thomforde [18], the phosphate level is desirable for fish culture. Bhatnagar [17] suggested 0.005-0.007 mgL-1 is optimum and productive. According to the expert opinion and the study in HR, the amount of phosphorus as PO43- is higher in the study area than that of the optimum value. Minimum value 0.13-0.17 mgL-1 was observed at point W1 (Mondakini canal falling zone) showing in brick red color, and a maximum value of 0.33-0.38 mgL-1 was observed at the point W5 (intake point of Mohora water Treatment Plant) highlighted with blue color (Figure 2j, Figure 3i).
Chloride is essential for life. In earth’s crust Chlorides constitute 0.05%. The standard Chloride content in fresh water is between 1 and 100 mgL-1. The main source of Chloride ions in water is underground aquifers, geological formations that contain groundwater. In this study, the observed Chloride content was between 25 and 54.5 mgL-1 (Figure 2k, Figure 3k). The highest value (48.0-54.5 mgL-1) was observed at the sample W2 shown in blue color and the lowest (25.0-30.9 mgL-1) at W3-W5 represent with brick red color. The result showed Chloride content level in HR is in favour of fish because Chloride concentrations in excess of about 250 mgL-1 can give rise to detectable taste in water, but the threshold depends upon the associated cations.
Sulfates occur in water as a result of leaching from gypsum and other common sulfate minerals. In natural water, it may be a few to several thousand mgL-1. Sulfate above 200 mgL-1 is undesirable for irrigation. In the present study, SO42- value was observed 17.0-24.0 (mgL-1) in the HR (Figure 2l, Figure 3m). Application of fertilizers to lands and leaching from cesspools contribute nitrate to groundwater. Wastes from chemical fertilizer manufacturing plants are also significant source of nitrate. Thunderstorm, nitrogen-fixing organisms and the action of bacteria on ammonia also form nitrate in nature. If man discharges sewage into a water body, bacterial action increases markedly. The acceptable level of nitrate in surface water is 20 mgL-1. The observed NO3– level found in this study was 2.6-18.0 (mgL-1) (Figure 2m, Figure 3o).
Observed Chromium, Manganese, Arsenic and Ammonium ion in HR water were within the safe limit for aquatic life. The concentrations of NH4+ (mgL-1) presence in the HR is shown in Figure 2n, Figure q.
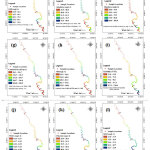 |
Figure 2: Surface water quality status of HR at five different locations (upstream to downstream) Click here to view figure |
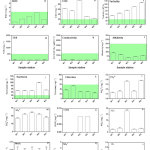 |
Figure 3: Comparison of important water quality parameter of HR with their relative standard value. |
The integrated water quality assessment using WPI for the five different stations are shown in the Table 4. Highest WPI value (1.89) was observed for the stations W2 and W5 According to the WPI range of water quality, WPI for HR has been from 0.9951 to 1.89 which indicates that this river water is moderately polluted since the found value ranged between 1 and 2. The quality of this water body is deteriorating day by day which is alarming for us.
Table 4: Water Pollution Index value of observed samples from HR
|
Sample ID |
WPI |
|
W1 |
0.9951 |
| W2 |
1.8900 |
|
W3 |
1.4075 |
| W4 |
1.7400 |
|
W5 |
1.8900 |
Another main objectives of this study is to develop Water Quality Index (WQI) to identify the drinking water source for the state government. The WQI is an extracted and estimated index that reflects the composite effects of all water quality parameters. Considering the standard value of different parameters according to WHO guidelines, WQI was calculated and the computation was shown in Table 5. In this case, the average value of each parameter was taken as an observed value.
Table 5: Computation of Water Quality Index of HR in respect of WHO guideline
|
Parameter |
AverageObserved Value (Ci) | Standard Value (WHO)(Si) | UnitWeight(wi) | Relative Weight (Wi) | Quality Rating (qi) |
SIi=Wi×qi |
|
Temp (°C) |
28.6 | 20-30 | 2.00 | 0.065 | 114.4 | 7.436 |
| DO (mgL-1) | 6.92 | 6.00 | 1.00 | 0.032 | 89.30 |
2.858 |
|
BOD (mgL-1) |
1.50 | 3.00 | 5.00 | 0.161 | 50.00 | 8.060 |
| COD (mgL-1) | 54.1 | 15.00 | 4.00 | 0.129 | 360.5 |
46.51 |
|
pH |
7.30 | 6.80-8.6 | 4.00 | 0.129 | 42.86 | 5.520 |
| Turbidity (NTU) | 87.6 | 5.0-25.0 | 2.00 | 0.064 | 584.0 |
37.38 |
|
TDS (mgL-1) |
61.1 | 1000 | 1.00 | 0.032 | 6.110 | 0.196 |
| Hardness (mgL-1) | 60.8 | 100 | 1.00 | 0.032 | 60.80 |
1.946 |
|
Chloride (mgL-1) |
35.3 | 250 | 3.00 | 0.096 | 14.12 | 1.356 |
| NH4+(mgL-1) | 0.84 | 500 | 3.00 | 0.096 | 0.167 |
0.016 |
|
PO43- (mgL-1) |
0.24 | 50.0 | 5.00 | 0.161 | 0.476 | 0.077 |
| ∑ SIi = 31 | ∑ Wi = 0.9974 |
∑ SIi = 111.3470 |
From this Study, WQI of HR was found 111.3 (Table 5). According to the WHO guideline it lies in grade five which means, the water is of poor quality, and it is not suitable for untreated drinking. This computation was performed considering the WHO guideline of 2013 for drinking water as Horton introduced this for the case of drinking water. To evaluate the water quality rating qi ideal value for different parameters were taken as zero according to WHO guideline except for DO and pH. Ideal value for DO was taken as 14.65, and for pH, it was taken 7.00 [29].
Moreover, based on the multi-parameters data of all five sampling locations, uncertainties and the uncertainty of the average values are calculated based on the two equations 7 and 8 discussed in the ending part of materials and methods. The highest uncertainty of average of conductivity 127.02 , Turbidity 87.6 , COD 54.1 and Alkalinity 59.7 , whereas the lowest uncertainty of average was observed 0.24 in PO43-.
Conclusion
This study concluded in two indexing system, WPI and WQI. From the study we obtained that average WPI was found between 1 to 2 and which indicates that this water body is moderately polluted. This is alarming news that if we do not take necessary steps now, we will lose our biggest natural economical source.
Another indexing system WQI allows for a general analysis of water quality on many levels that affect a stream’s ability to host life and whether the overall quality of water bodies poses a potential threat to various uses of water [7]. From this study on HR, the average WQI has been found 111.347 (Table 5), which, according to WHO guideline, is not suitable for drinking. This river is highly significant and economically important for our nation. This is a safe haven for fish breeding. Its water is supplied to the municipality after treatment for drinking purpose. Another important use of it is in farming land for cultivation. In our study we observed the presence of heavy metals in a trace amount. So, we can say that it will be a subject of big threat for aquatic organism very soon. If regular pollution is going on we may lose this natural carp breeding source very soon. Another important target of our study was to define the particular pollution sources. The presence of few textile industries, paper mills, power plant based on chemicals were observed close to the river. COD value and the presence of heavy metals in trace amount indicate that these industries contributes significantly to the pollution and they going to dominate. Pesticides and insecticides from tobacco farming land also contribute to pollution. To save this natural resource, necessary steps should be taken immediately. Specially stop the addition of pollutants from the nearby industries mainly through the Bamanshahi canal close to station W4. Effluents from these industries should be treated before discharge directly. Brick field should be shifted far away from the bank of the river. Tobacco farming should be banned and ultimately people of all stages should be concerned about it.
Acknowledgment
The research team is profoundly grateful to the authority of Chittagong WASA as they allowed us to use their laboratories and instruments. The authors are especially, thankful to Md. Abu Monchur who works as a chemist in Chittagong WASA.
Conflict of interest
None
References
- Tsai, C. f.; Islam, M. N.; Karim, R.; Rahman, K.S., Bang. Est., 1981, 4, 127-138.
- Mostafa, Y., 23 June 2018. The Daily Star, 2018.
- Akter, A.; Ali, M.H., Bang. Hyd. Sci, J., 2012, 57, 326-343.
- Gurunathan, A.; Shanmugam, C., W. L. and the Com., organized in Delhi, 2006.
- Bhuyan, M.; Bakar, M., Poll., 2017, 3, 429-441.
- Dwivedi, S.; Pathak, V., Ind. J. of Env. Pro., 2007, 27, 1036.
- Wu, Z.; Zhang, D.; Cai, Y.; Wang, X.; Zhang, L.; Chen, Y., Sci. Rep., 2017, 7, 17999.
- Filatov, N.; Pozdnyakov, D.; Johannessen, O.M.; Pettersson, L.H.; Bobylev, L.P., Spr. Sci. & Bus. Med., 2007.
- Lyulko, I.; Ambalova, T.; Vasiljeva, T., Pro. of Int. Wor. on Inf. for Sus. Wat. Man.,Nether., 2001, 449-452.
- Islam, M. S.; Akbar, A.; Akhtar, A. Y. S. H. A.; Kibria, M. M.; Bhuyan, M. S., A. Soci. J, 2007, 43, 61-70.
- Anwar, H.,The Ind. D. Bang., 2018.
- Association, A.P.H., Washington DC, 1991.
- Tyagi, S.; Sharma, B.; Singh, P.; Dobhal, R., Ame. J. of W. Res., 2013, 1, 34-38.
- Brown, R. M.; McClelland, N. I.; Deininger, R. A.; O’Connor, M. F., Spr. Bos. MA., 1972, 173-182.
- Organisation, W.H., Guid. for Drin. W., Fourth Edition,. 2013.
- Swann, L., Aqua. Ext., 1997.
- Bhatnagar, A.; Jana, S. N.; Garg, S. K.; Patra, B. C.; Singh, G.; Barman, U. K., C.C.S Haryana Agri., Hisar (India), 2004, 203, 210.
- Stone, N. M.; Thomforde, H. K., US Dep. of Agri. and Con. Gov. Coop., 2004, 1-4.
- Santhosh, B.; Singh, N. P., ICAR Res. Com. for NEH Reg., Tripura Center, Publication, 2007, 29.
- Bhatnagar, A.; & Devi, P., Int. J. of Env. Sci, 2013, 3, 1980.
- Delincé, G., Spr. Sci. & Bus. Med.,, 2013, 72.
- Piedrahita, R.H.; Lichtkoppler, F.,A.E.S. Int. Cent. for Aqua., Editor. 1997.
- Milijašević, D. R. A. G. A. N. A.; Milanović, A.; Brankov, J. O. V. A. N. A.; Radovanović, M., Arch. Bio. Sci Bel., 2011. 63, 819-824.
- Whitehead, P. G.; Wilby, R. L.; Battarbee, R. W.; Kernan, M.; Wade, A. J., Hyd. Sci. J., 2009. 54, 101-123.
- Ezenne, G. I.; Ndulue, E. L.; & Yakubu, O. L., J. of Agri. Eng. and Tech., 2014, 22, 131-139.
- Kramer, D.L., Env. Bio. of Fish., 1987. 18, 81-92.
- Iscen, C. F.; Emiroglu, Ö.; Ilhan, S.; Arslan, N.; Yilmaz, V.; Ahiska, S., Env. Moni. and Ass., 2008. 144, 269-276.
- Moyle, J.B.,Tran. of the Ame. Fish. Soc., 1949. 76, 322-334.
- Boah, D. K.; Twum, S. B.; Pelig-Ba, K. B., Env. Sci., 2015. 3, 11-16.
- Chatterjee, C.; Raziuddin, M., Nature, Env. and Poll. Tech., 2002, 1, 181-189.

This work is licensed under a Creative Commons Attribution 4.0 International License.
![]()
A New Edition of Web of Science
Journal Impact Factor
2022: 0.5
Five Year: 0.8
Journal is Indexed in

Cabells Whitelist
![]()


