Advancement and Validation of New Derivative Spectrophotometric Method for Individual and Simultaneous Estimation of Diclofenac sodium and Nicotinamide
Samar Ahmed Darweesh , Husam Saleem Khalaf
 , Rokayia Samir Al-Khalisy
 , Hamsa Muneam Yaseen
 and Ruaa Muayed Mahmood
Department of Chemistry, College of Education for Pure Science-Ibn Al-Haitham, University of Baghdad, Baghdad, Iraq.
Corresponding Author E-mail: husam250@yahoo.com
DOI : http://dx.doi.org/10.13005/ojc/340357
Article Received on : February 27, 2018
Article Accepted on : April 03, 2018
Article Published : 06 May 2018
Derivative spectrophotometry, which is primarily based on the first and second derivative spectra of absorption, was applied for individual and simultaneous spectrophotometric determination of Diclofenac sodium (DS) and nicotinamide (NAM) in the ultraviolet region. The method depends on 1st and 2nd derivative UV spectrophotometry, with the amplitude of peak-to-base line, peak to peak, the area under peak at selected spectrum intervals and zero-crossing at certain wavelengths for each compound measurement. Under optimal conditions, a linear working range of 5-80 μg.ml-1 and 10-140 μg.ml-1 for (DS) and (NAM) with correlation coefficient R2 between 0.9938-0.9998. The mean % recoveries were found to be in the range of 97.95-102.50 % for two drugs. The proposed technique has been effectively applied to the estimation of (DS) and (NAM) in pharmaceutical formulations.
KEYWORDS:UV-Visible Spectrophotometer; Derivative Spectrophotometric Method; Simultaneous Determination; Diclofenac Sodium; Nicotinamide
Download this article as:| Copy the following to cite this article: Darweesh S. A, Khalaf H. S, Al-Khalisy R. S, Yaseen H. M, Mahmood R. M. Advancement and Validation of New Derivative Spectrophotometric Method for Individual and Simultaneous Estimation of Diclofenac sodium and Nicotinamide. Orient J Chem 2018;34(3). |
| Copy the following to cite this URL: Darweesh S. A, Khalaf H. S, Al-Khalisy R. S, Yaseen H. M, Mahmood R. M. Advancement and Validation of New Derivative Spectrophotometric Method for Individual and Simultaneous Estimation of Diclofenac sodium and Nicotinamide. Orient J Chem 2018;34(3). Available from: http://www.orientjchem.org/?p=45434 |
Introduction
Derivative spectrophotometry is a technique of incredible usefulness for separating both qualitative and quantitative information from spectra made of uncertain bands by utilizing the first or higher derivatives of absorbance concerning wavelength[1]. This technique offers different advantages over the customary absorbance methods, for example: the separation of the sharp spectral features over the huge bands and the improvement of the resolution of overlapping spectra[2] what’s more, allow the assay of certain analyses from complex mixtures or matrices via mathematical interpretation of the absorption signal [3]. UV-Vis spectroscopic approach for analysis is broadly utilized within the determination of drug in pharmaceutical preparations and for separation studies, which disposes interference from the formulation of matrix by utilizing zero-crossing techniques[4].
Many reports were found for the analysis in individual form particularly for (DS) and (NAM) including spectrophotometric method [5-8], chromatographic method [9,10], flow injection [11], voltammetry [12], potentiometric [13], electrochemical method [14], capillary electrophoresis [15,16].
Experimental
Instruments
[UV]-Visible double beam spectrophotometer with 10 mm quartz cell shimadzu 1800, a personal computer.
Chemicals and reagents
Pharmaceutical grade (DS) and (NAM) powder received in pure form (99.99 %) was provided as an endowment from the State Company for Drug manufacture and Medical Appliances Samara-Iraq (SDI), methanol (99.7 %) provide by (SCR). All chemical substance utilized were of analytical grade.
Preparation of standard stock solution (200 µg. mL-1), Diclofenac sodium and nicotinamide
The standard solution of (DS) and (NAM) were prepared by dissolving accurate weighted 20.0 mg of pure drug in 10.0 ml of methanol and further diluted to 100 ml with distilled water.
Preparation both Diclofenac sodium and nicotinamide from dosage form
The content of 10 tablets and capsules was grinded and blended well. Take accurately weighted from a specific quantity of the fine powder to give an equivalent to 50 mg for (DS) tablets and 20 mg for (NAM) capsules and dissolve in ten mL of methanol then diluted to the mark with distilled water in a volumetric flask 100 ml. The solution was filtered by utilizing filter paper (Whatman No.41) to evade any undissolved or suspended components before use; also the first part of the solution filtrate was rejected.
Procedures
Individual determination of Diclofenac sodium and nicotinamide
In 10 mL calibrated flask transfer aliquots of (DS) standard solutions containing 50-800 μg (or NAM standard solutions containing 100-1400 μg), and dilute with 10 % methanol solution to the mark. The spectrum for each solution was recorded against a 10 % methanol solution as blank. Zero order spectrums were then manipulated for each to get its first derivative (D1) and second derivative (D2).
Simultaneous determination of Diclofenac sodium and nicotinamide
The content of a series of 10 mL calibrated flasks containing different amounts (50-800) μg of (DS) standard solutions and 50 μg of (NAM) solution the mixture was then diluted with 10 % methanol solution to the mark. Record the spectrum for each solution against a 10 % methanol solution as a blank. The recorded spectra were then manipulated to get D1 and D2.(II) The content of a series of 10 mL calibrated flasks containing different amounts (100-1400) μg of (NAM) standard solutions and 100 μgof (DS) solution the mixture was then diluted with 10 % methanol solution to the mark. The spectrum for each solution was recorded against a 10 % methanol solution as a blank. The recorded spectra were then manipulated to get D1 and D2.
Result and Discussion
Absorption spectra
The absorption spectra were record of each compounds (DS), (NAM) then their mixture against 10 % methanol solution as a blank. Figure 1 (a) demonstrates the absorption spectrum of (DS) 10 μg. mL-1 with maximum wavelength at 276 nm, (b) demonstrates the absorption spectrum of (NAM) 50 μg. mL-1 with two maxima wavelength of absorption at 214 nm and 262 nm. The aggregate spectrum to the mixture is demonstrating in (c) with two λmax 212 and 266 nm.
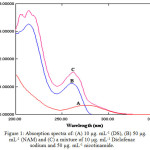 |
Figure 1: Absorption spectra of: (A) 10 μg. mL-1 (DS), (B) 50 μg. mL-1 (NAM) and (C) a mixture of 10 μg. mL-1 Diclofenac sodium and 50 μg. mL-1 nicotinamide. |
First derivative mode and 2nd derivative mode
The derivative spectra 1st, 2nd order of (DS) and (NAM) and for their blend are appeared within Figure 2, Figure 3 respectively. Clearly there is a large overlap in spectra of Diclofenac sodium and nicotinamide hence, their determination, making use of the zero order absorption measurements, at the point when present in the same solution it is very difficult when utilizing customary two wavelengths of λmax or the tangential base-line approach strategies [17]. Then again, derivative technique is of a specific utility in finding the concentration of single component in a blends, with a large overlapping in spectrum. Consequently, both first, second order derivative spectrophotometric methods have been applied.
In the existing work, graphically peak-to-baseline, peak to peak, zero-crossing technique in addition to peak area were utilized to deal with derivatives spectra to complete the data. Truth be told, the any one of these techniques in the 1st and 2nd derivative modes indicate good proportion to Diclofenac sodium and nicotinamide amounts in their blends.
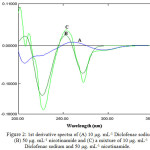 |
Figure 2: 1st derivative spectra of (A) 10 μg. mL-1 Diclofenac sodium, (B) 50 μg. mL-1 nicotinamide and (C) a mixture of 10 μg. mL-1 Diclofenac sodium and 50 μg. mL-1 nicotinamide. |
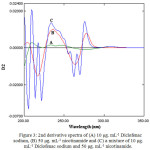 |
Figure 3: 2nd derivative spectra of (A) 10 μg. mL-1 Diclofenac sodium, (B) 50 μg. mL-1 nicotinamide and (C) a mixture of 10 μg. mL-1 Diclofenac sodium and 50 μg. mL-1 nicotinamide. |
Figure 4 and Figure 5 illustrate sets of 1st order spectra of medley containing (5-80) μg.ml-1 of Diclofenac sodium in the existence of (5 μg.ml-1) nicotinamide and (10-140) μg.ml-1 of nicotinamide in the existence of (10 μg.ml-1) Diclofenac sodium respectively. Figure 4 indicate that when the amount of nicotinamide is kept constant and varied the concentration of Diclofenac sodium, the peak-to-base line, peak to peak, peak areas and zero crossing of nicotinamide were proportional to the concentration of Diclofenac sodium. Moreover, the same features were found for the determination of nicotinamide in Figure 5, i.e. area under peak, peak-to-baseline, peak to peak and zero crossing of Diclofenac sodium were in proportion to the concentration of nicotinamide (Table 1 and 2).
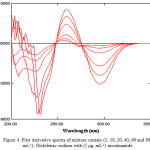 |
Figure 4: First derivative spectra of mixture contain (5, 10, 20, 40, 60 and 80 μg. mL-1); Diclofenac sodium with (5 μg. mL-1) nicotinamide. Click here to View figure |
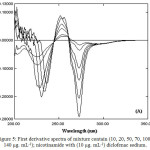 |
Figure 5: First derivative spectra of mixture contain (10, 20, 50, 70, 100 and 140 μg. mL-1); nicotinamide with (10 μg. mL-1) diclofenac sodium. |
In the further sets of 2nd derivative of the same above blend, as illustrated in Figure 6 and Figure 7. By applying the same mentioned approached in account peak amplitudes (in millimeter) at peak-to-baseline, peak to peak and at zero crossing point of the other compound, and peak areas at selected wavelengths intervals enable the measurement of Diclofenac sodium and nicotinamide respectively (Table 1 and 2).
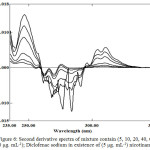 |
Figure 6: Second derivative spectra of mixture contain (5, 10, 20, 40, 60 and 80 μg. mL-1); Diclofenac sodium in existence of (5 μg. mL-1) nicotinamide. |
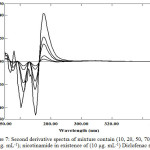 |
Figure 7: Second derivative spectra of mixture contain (10, 20, 50, 70, 100 and 140 μg. mL-1); nicotinamide in existence of (10 μg. mL-1) Diclofenac sodium. |
Table 1: Statistical analysis for the determination of Diclofenac sodium.
| Drug | Order of derivative | Mode of calculations | λ (nm) | Regression equation | R² | Slope |
| Diclofenac sodium | First | Peak to baseline | 259 | y = 0.0011x + 0.0014 | 0.9955 | 0.0011 |
| Peak to baseline | 295 | y = -0.0013x + 0.0002 | 0.9955 | -0.0013 | ||
| Peak to peak | 259-295 | y = 0.0024x + 0.0012 | 0.9955 | 0.0024 | ||
| Area under peak | 248.5-276 | y = 0.0188x – 0.0095 | 0.9961 | 0.0188 | ||
| Area under peak | 276-334 | y = -0.0367x + 0.1702 | 0.9944 | -0.0367 | ||
| Zero cross | 260 | y = 0.0011x + 0.0008 | 0.9948 | 0.0011 | ||
| Zero cross | 296 | y = -0.0013x + 0.0001 | 0.9955 | -0.0013 | ||
| Second | Peak to baseline | 247 | y = 0.0002x + 0.0004 | 0.9965 | 0.0002 | |
| Peak to baseline | 310 | y = 7E-05x – 3E-05 | 0.9961 | 7.00E-05 | ||
| Area under peak | 239-260 | y = 0.0017x + 0.0011 | 0.9988 | 0.0017 | ||
| Area under peak | 260-294 | y = -0.0027x + 0.0154 | 0.9961 | -0.0027 | ||
| Area under peak | 294-340 | y = 0.0013x – 0.0005 | 0.9988 | 0.0013 | ||
| Zero cross | 252 | y = 0.0001x + 0.0002 | 0.9955 | 0.0001 | ||
| Zero cross | 272 | y = -0.0001x – 0.0002 | 0.9938 | -0.0001 | ||
| Zero cross | 310 | y = 7E-05x – 3E-05 | 0.9961 | 7.00E-05 |
Table 2: Statistical analysis for the determination of nicotinamide.
| Drug | Order of derivative | Mode of calculations | λ (nm) | Regression equation | R² | Slope |
| Nicotinamide | First | Peak to baseline | 253 | y = 0.0007x + 0.0057 | 0.9994 | 0.0007 |
| Peak to baseline | 272 | y = -0.0021x + 0.0068 | 0.9998 | -0.0021 | ||
| Peak to peak | 253-272 | y = 0.0028x – 0.0011 | 0.9998 | 0.0028 | ||
| Area under peak | 244.5-261 | y = 0.0074x + 0.0393 | 0.9995 | 0.0074 | ||
| Area under peak | 261-334 | y = -0.0256x – 0.5788 | 0.999 | -0.0256 | ||
| Zero cross | 248 | y = 0.0005x – 0.0009 | 0.9998 | 0.0005 | ||
| Zero cross | 276 | y = -0.0014x + 0.0017 | 0.9997 | -0.0014 | ||
| Second | Peak to baseline | 244 | y = 0.0002x + 0.0013 | 0.9995 | 0.0002 | |
| Peak to baseline | 262 | y = -0.0004x + 6E-05 | 0.9998 | -0.0004 | ||
| Peak to baseline | 270 | y = -0.0003x – 0.0006 | 0.9995 | -0.0003 | ||
| Peak to baseline | 275 | y = 0.0003x – 0.0013 | 0.9996 | 0.0003 | ||
| Peak to peak | 270-275 | y = 0.0006x – 0.0003 | 0.9992 | 0.0006 | ||
| Area under peak | 272-329 | y = 0.0039x + 0.0235 | 0.9995 | 0.0039 |
Accuracy and Precision
Under the optimum conditions, the accuracy and precision of the proposed method (peak to baseline, zero cross and area under the peak for each of first and second order derivative modes) were checked. Table 3 shows the values of relative error percent and relative standard deviation percent for two different level of concentration of Diclofenac sodium and nicotinamide with three replicate.
Table 3: Accuracy and precision of the methods.
|
Drug |
Approach of analysis |
Wavelengths λ (nm) |
Taken (μg.ml-1) |
Found * (μg.ml-1) |
RE% |
*RSD% |
|
Diclofenac sodium |
First order (area under peak)
|
248.5-276 |
30.00 |
30.34 |
1.133 |
2.130 |
|
60.00 |
59.57 |
-0.717 |
0.499 |
|||
|
Second order (area under peak)
|
239-260 |
30.00 |
29.62 |
-1.267 |
0.668 |
|
|
60.00 |
60.55 |
0.917 |
0.365 |
|||
|
nicotinamide |
First order (zero cross) |
248 |
50.00 |
49.70 |
-0.600 |
0.748 |
|
100.00 |
99.45 |
-0.550 |
0.235 |
|||
|
Second order (peak to base line)
|
262 |
50.00 |
50.38 |
0.760 |
0.878 |
|
|
100.00 |
99.67 |
-0.330 |
0.277 |
*Average of three determinations.
Application in dosage form
The proposed method first and second procedures were successfully applied for direct determination of Diclofenac sodium in tablets and nicotinamide in capsules. The results obtained are presented in Table 4, and are in quite agreement with the spiked values. Good recovery 97.95-102.50 % and RSD % values 0.667-2.005 % indicated the suitability of these methods for routine analysis of Diclofenac sodium and nicotinamide.
Table 4: Results for analysis of Diclofenac sodium and nicotinamide in four pharmaceutical formulation samples.
|
Pharmaceutical preparation |
Method of analysis |
λ(nm) |
amount (mg) |
Rec.% | *RSD % | |
|
Taken |
Found* | |||||
|
Olfen-50 Acion switzerland |
First order (area under peak) |
248.5-276.0 |
50.00 |
50.41 |
100.82 |
0.778 |
|
Second order (area under peak) |
239.0-260.0 |
50.00 |
49.68 |
99.36 |
0.702 |
|
|
Optifenac-50 M. H. drugs India |
First order (area under peak) |
248.5-276.0 |
50.00 |
49.54 |
99.08 |
0.667 |
|
First order (area under peak) |
239.0-260.0 |
50.00 |
49.25 |
98.50 |
0.806 |
|
|
Modoplex Caps M. V. C. India |
First order (zero cross) |
248.0 |
20.00 |
19.70 |
98.50 |
2.005 |
|
Second order (peak to base line) |
262.0 |
20.00 |
20.28 |
101.40 |
1.482 |
|
|
P-blex Caps S. D. I. Iraq |
First order (zero cross) |
248.0 |
20.00 |
20.50 |
102.50 |
0.959 |
|
Second order (peak to base line) |
262.0 |
20.00 |
19.59 |
97.95 |
1.244 |
|
*Average of three determinations.
Conclusion
Derivative Spectrophotometric technique was found to be sensitive, simple, rapid, economical, the results indicates that a good accuracy and precision of the proposed method, good recovery from the results applications in dosage form and it can be used in routine analysis of Diclofenac sodium and nicotinamide in their pure forms, dosage form without prior separation or treatment.
In this work, 1st and 2nd derivative modes indicate good proportion to Diclofenac sodium and nicotinamide amounts in pure form and in their blends, by graphically peak-to-baseline, peak to peak, zero-crossing technique in addition to peak area were utilized to deal with derivatives spectra to complete the data.
Reference
- C. B. Ojeda and F. S. Rojas “Recent developments in derivative ultraviolet /visible absorption spectrophotometry” Analytica Chimica Acta, (2004), 518, 1-24.
CrossRef - B. Stanisz, S. Paszun and M. Leśniak “Validation of UV Derivative Spectrophotometric Method for Determination of Benazepril Hydrochloride in Tablets and Evaluation of Its Stability” Acta Poloniae Pharmaceutica-Drug Research, (2009), 66(4), 343-349.
- H. Lakiss, M. Ilie, D. L. Baconi and D. Bălălău “Derivative UV Spectrophotometry Used for The Assay of Diazepam from Human Blood Plasma” FARMACIA, (2012), 60(4), 565-570.
- M. Attimarad, B. E. Al-Dhubiab, I. A. Alhaider, A B. Nair, N. S. Harsha and K. M. Ahmed “Simultaneous determination of moxifloxacin and cefixime by first and ratio first derivative ultraviolet spectrophotometry” Attimarad et al. Chemistry Central Journal, (2012), 6(105), 1-7.
- T. G. raju, A. Vinukonda, R. Akki, M. Gayatriramya, S. K. Gupta and V. V. Naik “Simultaneous Estimation of Diclofenac Sodium and Rabeprazole in Combined Dosage Form” IJRPC, (2012), 2(3), 873-875.
- M. C. Sharma and S. Sharma “Determination and Validation of UV Spectrophotometric method for Estimation of Paracetamol and Diclofenac Sodium in Tablet Dosage Forms Using Hydrotropic Solubilizing Agents” Int. J. PharmTech Res., (2011), 3(1), 244-247.
- P. L. López-de-Alba, L. López-Martínez, V. Cerdáb and J. Amador-Hernández “Simultaneous Determination and Classification of Riboflavin, Thiamine, Nicotinamide and Pyridoxine in Pharmaceutical Formulations, by UV-Visible Spectrophotometry and Multivariate Analysis” J. Braz. Chem. Soc., (2006), 17(4), 715-722.
CrossRef - V. E. Mantovania, H. C. Goicoecheab and A. C. Collado “Simultaneus Determination of Nicotinamide and Inosine in Ophtalmic Solutions by UV Spectrophotometry and PLS-1 Multivariate Calibration” Analytical Letters, (2001), 34, 363-376.
CrossRef - Z.S. Hamad and B.M. Yahya “High performance liquid chromatographic determination of diclofenac sodium in plasma of the rat” Iraqi Journal of Veterinary Sciences, (2013), 27(2), 103-107.
- E. F. Yagar, R. Eggers and T. H. R. Lang “Quantitative Investigation of Trigonelline, Nicotinic Acid, and Nicotinamide in Foods, Urine, and Plasma by Means of LC-MS/MS and Stable Isotope Dilution Analysis” J. Agric. Food Chem., (2008), 56 (23), 11114–11121.
CrossRef - D. T. Gimenes, J. M. de Freitas, R. A. A. Munoz and E. M. Richter “Flow-Injection Amperometric Method for Determination of Diclofenac in Pharmaceutical Formulations Using a Boron-Doped Diamond Electrode” Electroanalysis, (2011), 23(11), 2521-2525.
CrossRef - A. Afkhami, A. Bahiraei, T. Madrakian “Gold nanoparticle/multi-walled carbon nanotube modified glassy carbon electrode as a sensitive voltammetric sensor for the determination of diclofenac sodium” Materials Science and Engineering: C, (2016), 59, 168-176.
CrossRef - V. A. Sharnin, S. V. Dushina, M. A. Zevakin, A. S. Gushchina, K. V. Grazhdan “Potentiometric and calorimetric study on stability of nicotinamide complexes of silver(I) and copper(II) in aqueous ethanol and dimethylsulfoxide” Inorganica Chimica Acta, (2009), 362, 437-442.
CrossRef - H. Karimi-Maleh1, F. Tahernejad-Javazmi, M. Daryanavard, H. Hadadzadeh, A. A. Ensafi and M. Abbasghorbani “Electrocatalytic and Simultaneous Determination of Ascorbic Acid, Nicotinamide Adenine Dinucleotide and Folic Acid at Ruthenium(II) Complex-ZnO/CNTs Nanocomposite Modified Carbon Paste Electrode” Electroanalysis, (2014), 26, 962-970.
CrossRef - R. R. Cunha, D. T. Gimenes, R. A. A. Munoz, C. L. do Lago and E. M. Richter “Simultaneous determination of diclofenac and its common counter-ions in less than 1 minute using capillary electrophoresis with contactless conductivity detection” Electrophoresis, (2013), 34, 1423–1428.
CrossRef - D. D. Wise and J. B. Shear “Quantitation of nicotinamide and serotonin derivatives and detection of Flavin’s in neuronal extracts using capillary electrophoresis with multiphoton-excited fluorescence” Journal of Chromatography A, (2006), 11111, 153-158.
CrossRef - T. C. O’ Haver and G. L. Green “The Small Modulation Case: Derivative Spectroscopy” Anal. Chem., (1976), 48, 312.

This work is licensed under a Creative Commons Attribution 4.0 International License.


