Development of Zirconia Substituted 1393 Bioactive Glass for Orthopaedic Application
Development of Zirconia Substituted 1393 Bioactive Glass for Orthopaedic Application
Sandeep Kumar Yadav , Sarthak Ray, Md. Ershad, Vikash Kumar Vyas, Sunil Prasad, Akher Ali, Sushma Yadav, Manas Ranjan Majhi and Ram Pyare
Department of Ceramic Engineering, Indian Institute of Technology (Banaras Hindu University) Varanasi -221005, India.
Corresponding Author E-mail: sandeep.rs.cer.2006@gmail.com
DOI : http://dx.doi.org/10.13005/ojc/330605
Zirconia was used as a bone substitute, since it has excellent mechanical properties. It is also good biologically inert to bone tissue. In this study, we report on zirconia substituted 1393 bioactive glass. In novel melt-derived “1393” Bioactive glass (53 SiO2 , 6Na2O, 12 K2O, 5MgO, 20CaO, and 4 P2O5 wt %) with CaO was doped by ZrO2 for and were melted at 1400ºC in aluminium crucible in electric furnace with air as furnace atmosphere. Bioactivity of these samples were analysed by put in the SBF for different time periods. Hydroxy Carbonate Apatite layer was developed and identified by FTIR, XRD and SEM. Chemical durability was also determined by weight loss method. Density of the samples were determined and found to increase significantly with increasing amount of (0-2 wt %) zirconia, reason is due to replacement of lighter element of CaO has been replaced by heavier element ZrO2. Finally, this investigation clearly concluded that ZrO2 substituted bioactive glass would be potential biomaterials for biomedical applications.
KEYWORDS:Bio-active glasses; SBF; XRD; SEM; FTIR; pH; Chemical durability; Density
Download this article as:| Copy the following to cite this article: Yadav S. K, Ray S, Ershad M, Vyas V. K, Prasad S, Ali A, Yadav S, Majhi M. R, Pyare R. Development of Zirconia Substituted 1393 Bioactive Glass for Orthopaedic Application. Orient J Chem 2017;33(6). |
| Copy the following to cite this URL: Yadav S. K, Ray S, Ershad M, Vyas V. K, Prasad S, Ali A, Yadav S, Majhi M. R, Pyare R. Development of Zirconia Substituted 1393 Bioactive Glass for Orthopaedic Application. Orient J Chem 2017;33(6). Available from: http://www.orientjchem.org/?p=40490 |
Introduction
Ceramics which are used for filling and rebuilding of non-healing bone defects and for healing of damaged or diseased parts of the muscular-skeletal system is termed as bio ceramics [1].Bio inert (alumina, zirconia), bioactive (hydroxyapatite, glass, and glass-ceramics), resorbable (tricalcium phosphate) or porous for tissue in growth (hydroxyapatite-coated metals, alumina) may be used in the bio ceramic composites [2]. Several types of bioactive glasses are developed over past years. Bioactive glasses (BG) have been known for their bioactive properties and their aptitude to form a strong bond to bone by formation of hydroxyapatite surface layer [3]. Bioactive glasses (BGs) such as “45S5 Bio-glass®” (45 SiO2, 24.5CaO, 24.5Na2O, 6 P2O5 wt %) and “1393” (53 SiO2, 6Na2O, 12K2O, 5MgO, 20CaO, and 4 P2O5 wt %) compositions have been widely used for bone tissue engineering applications [2, 4]. Hench et al. examined the in vitro bonding mechanism with synthetic material because of the chemical reactions taking place over glass surface. These chemical reactions strongly help the implants to bond with the bone tissues; hence one can replace the diseased or damaged part of the human bone [5]. Many glass compositions have been developed by doping therapeutically active ions such as strontium, zinc, magnesium, fluoride and cobalt in silicate glass system have been discovered in the past [6-9].Several researches are going on for preparation and characterization of glasses and glass-ceramics, doped with some ions such as Zr, Li, Fe, Ti, K, Zn, Sr and Mg because of their unique effect on differentiation, osteoblastic cell proliferation and thus bone mineralization [10-15]. The ZrO2 substituted is widely used as a substrate in hard tissue applications due to its excellent strength and fracture toughness [16]. It was discovered from the reaction product obtained after heating gems by the German chemist Martin Heinrich Klaproth in 1789 [17]. Several research articles have suggested that zirconia has good chemical and dimensional stability, mechanical strength and toughness and it is also biologically inert [18]. Many study have shown that the compressive strength of ZrO2 is relatively higher than porous HA and ZA20 (20 wt. % Al2O3 added TZP) ceramics. In vitro evaluation has also shown that ZrO2 is not cytotoxic [19-21]. Vyas et. al [22-27] in an earlier investigation had also shown that the addition of cobalt oxide and nickel oxide up to 0-2.0 wt% in 45S5 glass (BG) and glass-ceramic (BGC) has resulted an increase physico- mechanical properties and bioactivity of their samples due to formation Co-O-Si and Ni-O-Si bonds. Tripathi et. al [28] have also found the characterization of Li2O–CaO–Al2O3–P2O5–SiO2 glasses as bioactive material and all the elastic moduli values were establish to increase with the increasing in Al2O3/Li2O ratio.
In the current investigation an endeavour has been made to study the construct of zirconia doping in silica-based bioactive glass and to verify its bioactivity and other characteristics.
Material and Methods
Preparation of Glass
For the source of SiO2 [15], Na2O, CaO, K2O ,P2O5 and MgO, Fine grained quartz, anhydrous sodium carbonate [Na2CO3], anhydrous calcium carbonate [CaCO3], Potassium Carbonate [K2CO3], ammonium dihydrogen orthophosphate [NH4H2PO4] and Magnesium Carbonate [MgCO3] respectively were used [4]. The ZrO2 is available as it is and was added for preparation of bioactive glasses. All the batch materials were of analytical grade chemicals and were used without further purification. The weighed batches were mixed properly with the help of mortar and pestle. Before mixing the mortar and pestle were cleaned thoroughly and allowed to dry properly. After thorough mixing of batch materials were kept in alumina crucible and placed in an electric furnace. The furnace temperature was set to 1400oC and the duration to reach 1400oC was set to 3 hours and after reaching 1400oC the steady state was maintained for more 3 hours. After melting the prepared bioactive glass samples were poured into moulds and were directly transferred to a regulated muffle furnace at the temperature of 500oC for annealing. The muffle furnace was left to cool to room temperature after 1 hour. Annealing is done to remove the internal stress after the glasses are formed.
Table 1: Composition of base and doped glass.
| Glass sample \ Composition |
SiO2 |
Na2O |
K2O |
P2O5 |
MgO |
CaO |
ZrO2 |
| G-1 |
53 |
6 |
12 |
4 |
5 |
20.0 |
0.0 |
| G-2 |
53 |
6 |
12 |
4 |
5 |
19.5 |
0.5 |
| G-3 |
53 |
6 |
12 |
4 |
5 |
19.0 |
1.0 |
| G-4 |
53 |
6 |
12 |
4 |
5 |
18.5 |
1.5 |
| G-5 |
53 |
6 |
12 |
4 |
5 |
18.0 |
2.0 |
Simulated Body Fluid (SBF)
Kokubo and his teams developed Simulated Body Fluid (SBF) which has similar inorganic ion concentrations to those of human extracellular fluid [22, 29-31].The ion concentrations of SBF are given on Table 2.
Procedure
The HCl available in the laboratory is of 11.6 N. So it was diluted to 1 N-HCl by the following formula.
N1V1 = N2V2
Where N1, N2 = Normality of 1st and 2nd solution respectively
V1, V2 = Volume of 1st and 2nd solution respectively
We have taken 100 ml distilled water and we need to find out how much HCl of 11.6N is required to be mixed with it to get 1N-HCl solution.
11.6 × V1 = 1 × 100
=> V1 = 8.62 ml
So 8.62 ml of 11.6N HCl was mixed with 100ml of distilled water to get 1N-HCl.
700 ml of distilled water is poured into magnetic stirrer.
The 1 to 5 materials mentioned in the table 2 were added one by one.
The 1N-HCl was added to the above mixture of about 20 ml and pH was maintained to be 2.0/2.5.
Then the material numbered 7-8 were added one by one slowly.
Finally the tris-buffer was added very slowly. Then HCl was added and the pH was adjusted to be within 7.2/7.25.
Thus, SBF solution was prepared which was used forevaluation of bioactivity of artificial materials in vitro.
Table 2: Ion concentration (m M/liter) of SBF.
|
Ions |
Na+ |
K+ |
Mg2+ |
Ca2+ |
HCO3– |
HPO42- |
SO42- |
Cl– |
|
SBF |
142.0 |
5.0 |
1.5 |
2.5 |
4.2 |
1.0 |
0.5 |
147.8 |
|
WBC |
142.0 |
5.0 |
1.5 |
2.5 |
27.0 |
1.0 |
0.5 |
103.0 |
Characterization
Using the XRD, crystalline phases present in before and after SBF treated glass samples were identified. The samples were ground to 75μm and subjected to XRD using RIGAKU-Miniflex II diffractometer of range between 20° and 80°. Fourier trans-form infrared (FT-IR) spectrometer (VARIAN scimitar 1000, USA) range was used to investigate the functional groups present in bio-glass samples in the range of 4000–400 cm-1. The surface morphology of bioactive glass samples was analysed by SEM (Inspect S50, FEI) before and after SBF behaviour.
In vitro Bioactivity Test
In vitro test was performed to examined the bioactivity of all samples by immersing 0.5 g of each samples in 50 ml of SBF solution in a plastic box and incubated at 37.5 °C in a static condition for 2, 5, 7, 15 and 31 days. pH was also measured using Universal Bio microprocessor pH meter calibrated with buffer solutions of pH 4.00 and 7.00 at room temperature. pH values have been recorded during above given time periods. The surface morphology of bioactive glass samples was analysed by SEM (Inspect S50, FEI) before and after SBF behaviour. The glass powders (1g) were hard-pressed (load of 10 MPa) into pellet forms in a hand pelletizer machine using an evocable die to produce discs of 10 mm in diameter. The carboxymethyl cellulose (CMC) was used as a binder for making pellets. The glass pellets were put in SBF (10 ml) for 15 days at 37.5ºC. Samples were coated with gold before SEM analysis.
Density Measurement
The density of samples was measured by Archimedes principle at room temperature. For immersing the samples into water thin copper wire was used. The density was determined from the following equation:
Density= (Ma / (Ma – Mw))*0.988
Ma Mass in air and Mw is the Mass in water.
The measurements were carried out in triplicate.
Weight Loss Measurement
The solubility of bioactive glasses was finding by measuring weight loss in SBF at 37.5°C in the incubator. With the help of 500 grit polishing papers the samples were polished. Then they were washed in acetone for a minute and were placed in small plastic containers which contain SBF. On various days, the samples were taken out and with the help of tissue excess moisture was removed. Then the samples are weighted. The percentage changes in weight loss were directly correlated to glass corrosion or solubility in SBF. The amount of weight loss was calculated using the following equation:
Weight loss (mg/g) = (Wi – Wf)/Wi
Where Wi is the initial weight of the specimen and Wf the weight on different days.
Result and Discussion
FTIR Absorbance Spectrometric Investigation of Bioactive Glass
Fig. 1 shows the FT-IR absorbance spectra of glass samples before put into SBF solution. From Fig-1it was trend that G-1 and G-2 are showing almost same peak i.e. at wave number 1338.54384 cm-1 respectively. Another peak at 1031 and 945cm-1 are shown by G-1 and G-2. From the infrared absorption band table we can see that these peaks are referring to -O-Si- bond and -Si-P- bond [15]. The rest three glasses are showing peaks in the range 1562, 1556 and 1558 , 1338 and 945, 943, 947 cm-1. The 1338 cm-1 wave number corresponds to P=O bond [32-38]. The wave number 1556 cm-1 corresponds to –Si-P- bond [39]. The FTIR spectra peaks of G-2, G-3, G-4 and G-5 samples have the same behaviour of G-1 with small change in the peaks intensities as shown in the fig.-1. The glasses doped with Zirconia are not showing remarkable changes in the FTIR absorption spectral characteristics.
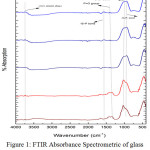 |
Figure 1: FTIR Absorbance Spectrometric of glass before immersion into SBF Click here to View figure |
In vitro Bioactivity by FTIR Absorbance Spectrometric
The FT-IR absorbance spectral bands of the glasses before and after immersion in SBF for different days such as 2, 5, 7, 15, and 31 days were shown in Fig 2-6. The increased in the intensity of absorption band is due to increase in molecular concentration of species on the surface of the glasses after soaking into SBF with time [40, 41].
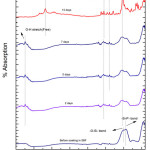 |
Figure 2: FTIR of glass sample (G-1) after drenched in SBF Click here to View figure |
The FTIR analysis of G-1 before and after drenched into SBF solution for 2, 5, 7, 15 and 31 days were presented in Fig-2. The new bands were establish to come out after soaking into 2 days in SBF solution and the corresponding wave numbers are 3745,1558,738 cm-1. The FTIR absorbance spectral band at 738 corresponds to Si-O-Si symmetric stretch of tetrahedral non -bridging oxygen atoms [15]. The major bands at about 1558 are credited to Si-P bond. On 15th day and 31st day peaks are found out at 3184 cm-1 which corresponds to –OH group (associated). The 1296 cm-1 wave number corresponds to P=O bond. The band corresponds to wave number 3745 cm-1 belongs to hydroxyl group (O-H stretch (free)) [42]. This long duration of the sample soaked into SBF shows small decrease in the intensities of the bands which is the result of formation of hydroxyl apatite (HA) layer [43].
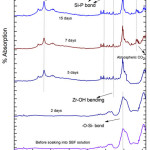 |
Figure 3: FTIR of glass sample (G-2) after drenched in SBF Click here to View figure |
Fig. 3 depict it the FT-IR analysis of G-2 bothe before, after drenched into SBF solution for 2, 5, 7, 15 and 31 days. On 5th days of soaking the prominent wave numbers are obtained at 3136, 1552, 1338, 1028 cm-1. The 1552 corresponds to Si-P bond. Here a new peak was obtained corresponding to 1338 cm-1 wave number which is associated with Zr-OH bonding [37, 38]. This is because bio glass is doped with zirconia. The band corresponding to wave number 1028 cm-1 is Si-O-Si stretching bond [15]. The bands at 652 cm-1 correspond to (carbonate) C-O stretching mode. The wave number 3136 cm-1 is 31 days corresponds to OH group (associated). This long duration of the sample soaked into SBF shows small decrease in the intensities of the bands which is the result of formation of hydroxyl corbonate apatite (HA) layer [43].
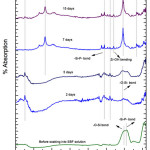 |
Figure 4: FTIR of glass sample (G-3) after drenched in SBF Click here to View figure |
Fig. 4 depicted the FT-IR analysis of G-3 before and after drenched it into SBF for 2, 5, 7, 15 and 31 days. On 5th days of soaking, the prominent wave numbers are obtained at wave number 3745, 3136, 2553, 2158, 1558 , 1338, 1016 , 652 cm-1 respectively. The peak obtained at 1338 is corresponds to Zr-OH bonding [44,45]. This is because bio glass is doped with zirconia. The band corresponding to wave number 1016 cm-1 is Si-O-Si stretching bond [15]. The wave number of 1558 cm-1 is linked with Si-P bond. The bands at 652 and 2553 cm-1are correspond to (carbonate) C-O stretching mode. The wave number at 3136 and 3745 cm-1are corresponds to OH group (associated) OH group (Free) respectively. This long duration of the sample soaked into SBF shows small decrease in the intensities of the bands which is the result of formation of hydroxyl carbonate apatite (HA) layer [43].
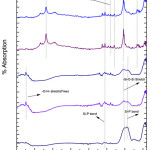 |
Figure 5: FTIR of glass sample (G-4) after drenched in SBF Click here to View figure |
Fig. 5 depicted the FTIR analysis of G-4 before and after drenched it into SBF solution for 2, 5, 7, 15 and 31 days. On 15th days of soaking, the prominent wave numbers obtained are at 3348, 1629, 1558, 1398, 1037, 628 cm-1. The band corresponding to wave number 1037 is Si-O-Si stretching bond [15]. Here the peak obtained at 1398 cm-1 wave number is corresponds to Zr-OH bonding [44, 45]. This is because bio glass is doped with zirconia. The wave number of 1558 cm-1 is associated with Si-P bond. The bands at 628 cm-1 corresponds to (carbonate) C-O stretching mode. The wave number at 3136 cm-1 corresponds to OH group (associated). This long duration of the sample soaked into SBF shows small decrease in the intensities of the bands which is the result of formation of hydroxyl carbonate apatite (HA) layer [43].
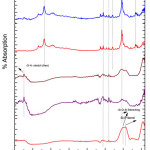 |
Figure 6: FTIR of glass sample (G-5) after drenched in SBF Click here to View figure |
Fig. 6 depicted the FTIR analysis of G-5 before and after drenched it into SBF solution for 2, 5, 7, 15 and 31 days. The G-3 sample has a peak at wave number 1028 cm-1 which corresponds to Si-O-Si symmetric stretching. On 15th day of soaking, the prominent wave numbers obtained are at wave number 3290, 1629, 1558, 1398, 1037, 628cm-1 respectively. The band corresponding to wave number 1037 is Si-O-Si stretching bond [15]. Here the peak obtained at 1398 cm-1 wave number is corresponding to Zr-OH bonding [44, 45]. This is because bio glass is doped with zirconia. The wave number of 1629 cm-1 is associated with Si-P bond. The wave number of 1558 cm-1 is associated with P=O bond. The bands at 628 cm-1 corresponds to (carbonate) C-O stretching mode. The wave number at 3290 corresponds to OH group (associated). This long duration of the sample soaked into SBF shows small decrease in the intensities of the bands which is the result of formation of hydroxyl carbonate apatite (HA) layer [43].
Bioactivity Shown by X-Ray Diffractometer
Fig. 7-11 shows the XRD of the glass samples (G-1, G-2, G-3, G-4 and G-5) before and after putting in SBF for 15 days. The bioactive glasses have shown amorphous nature as there is no sharp peak in the XRD before immersion into SBF solution. The graphs which are drawn after soaking into 15 days in SBF solutions showed broad peaks within the range of 30º to 35º.
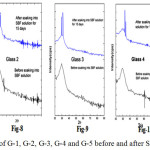 |
Figure 7-11: XRD of G-1, G-2, G-3, G-4 and G-5 before and after SBF for 15 days
|
Fig. 7-11 Contains the XRD pattern of Hydroxy Carbonated Apatite (HCA) powder to compare formation of HA layer on the surface of the SBF treated glass samples [46]. The XRD graphs of the SBF treated samples have clearly shown the formation of crystalline HA on their surfaces after putting in SBF for 15 days. From figures 7-11 it was observed with increase in Zirconia content the number of peaks becoming more in numbers and broad. The XRD peak located at around 32ºcorresponds to Hydroxyapatite [Ca10 (PO4)6(OH) 2] and the diffraction peaks were matched with the standard PDF#: 740565 [46].
Here it is identified that HA layer is getting formed when zirconia doped 1393 bioactive glasses were immersed into SBF solutions for varying period. The diffraction pattern of all the bioactive glasses showed the Hydroxy Carbonate Apatite crystalline phases. With increase in zirconia content the peaks which belong to HA were getting sharper.
pH Performance in SBF
Variation in pH values of bioactive glass after drenched into simulated body fluid (SBF) for 2, 5, 7, 15 and 31 days are presented in Fig 12. It was observed that up to 7 days all glass samples are showing increase in pH values almost linearly from pH value 7.3. The G-4 bioactive glass is showing maximum pH value on 7th day i.e. 9.5. Due to the addition of zirconia there are variations in the pH values for different samples. The G-4 bioactive glass is showing maximum pH at the end of 31st day. The G-4 which consists of 1.5 wt% of Zirconia is showing maximum pH value. It was found that in all cases the pH value is decreasing after 7 days and attended a constant value up to 31st days. The increase in pH values of bioactive glass in SBF is due to release of Ca2+ and Na+ ions from the sample surface [22, 23, 25, 26]. The sample number G-4 with higher zirconia content was found to show maximum pH value may be due to high rate of dissolution as compared to base sample G-1. The incorporation of Zirconia into 1393 glass resulted in an increase in the pH of SBF. Their high degradation rate leads to a higher pH value and this agrees to the condition of formation of HA like layer on the surface of the samples with more crystallinity.
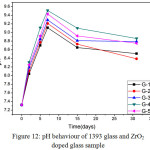 |
Figure 12: pH behaviour of 1393 glass and ZrO2 doped glass sample Click here to View figure |
Weight Loss Measurement
Fig. 13 shows the % weight losses of glasses are presented in Fig-13. It was observed that the base glass which is un-doped is showing less weight loss after soaking into SBF solutions. In all cases up to 7 days the weight loss is increasing proportionately with time and after that weight loss is almost constant for respective samples. From the pH graph the inference is already drawn that the pH is increasing due to release of Ca2+ and Na+ ion into SBF solution that means weight loss in G-4 glass is more which is exactly shown by the weight loss graph. It was found from that up to 7 days the weight loss in G-3, G-4 and G-5 glasses are almost same. That means the glasses with higher content of zirconia are possessing higher rate of dissolution, so % weight loss is more.
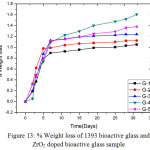 |
Figure 13: % Weight loss of 1393 bioactive glass and ZrO2 doped bioactive glass sample Click here to View figure |
Density Measurement
Fig. 14 shows the density of ZrO2 doped 1393 glass. It is observed that the density of un-doped sample is found to be 2.44 gm/cm3 and gradually it is increasing up to G-5 which is the highest doped glass ceramic(2.0 wt% Zirconia). The increase in density is due to replacement of CaO with ZrO2 which is attributed due to the replacement of a light element (density of CaO– 3.35 gm/cm3) with a heavier one (ZrO2 – 5.68 gm/cm3). The rate of increment of density is not same in all the cases as the density of G-3 is increased slightly whereas the rate of increment of density from G-3 to G-4 is more. The total range of density is found to be from 2.44 gm/cm3to 2.495 gm/cm3. The density of bioactive glass is directly proportional to the solidity of the configuration [22, 23,25,26]. Here G-4 and G-5 glass are showing approximately same density which means these materials are suitable for making scaffolds for bone tissue engineering [47].
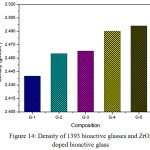 |
Figure 14: Density of 1393 bioactive glasses and ZrO2 doped bioactive glass Click here to View figure |
Surface Morphology by SEM
Fig. 15 and Fig. 16 show the surface morphology of base glass (G-1) and the bioactive glass samples (G-2, G-3, G-4 and G-5) by their SEM images before and after the put in the SBF for 15 days at 37.5ºC. The reflections in the SEM images are showing the glassy surfaces.The SEM images of samples before and after put in SBF shown uniform polycrystalline particle on the surfaces of the glass. These developed crystals on the surface of the glasses are assumed to be HCA [48]. It is observed that for increasing ZrO2 content, the crystalline phase formed is getting uniform shapes on the glass surfaces and for G-5 the hydroxyl carbonate apatite formed is having needle like structure. It can be concluded that the zirconia doped 1393 glasses can also generate HA like structure on their surfaces after immersion in to SBF solution. Previously It was already found out from the XRD results and FTIR spectrometry that, the HA layer is getting formed after immersion of glass into SBF for 15 days.
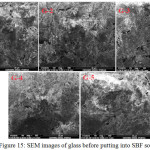 |
Figure 15: SEM images of glass before putting into SBF solution Click here to View figure |
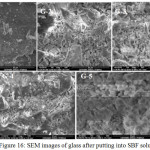 |
Figure 16: SEM images of glass after putting into SBF solution Click here to View figure |
Conclusion
The XRD analysis showed the amorphous nature of the glass and FTIR absorbance spectra, pH behaviour; XRD and SEM images show the formation of HCA layer on the surface bioactive glasses after putting in SBF. Densities of substituted bioactive glasses are increased with increasing concentration of ZrO2 while their Chemical durability decreased.
So it can be concluded from the experimental work that all the ZrO2 substituted bioactive glass have shown improved properties. Among all the samples the G-4 glass is the best one as it has shown high pH value which suggests formation of HCA layer. It can be observed from the FTIR diagram of G-4 that all the bonds are showing prominent peaks and SEM images are also showing impressive results of HA layer formation. The prepared bioactive glasses can be used as for bone tissue engineering applications.
References
- Sergey, V. D.; Calcium Orthophosphates as Bio-ceramics: State of the Art., J. Function Biomaterial. 2010, 1, 22–107.
CrossRef - Hench, L.L.; Bio-ceramics, J. Am. Ceram. Soc. 1998, 74 (7), 1487-1510.
CrossRef - Gerhardt, L.C.; Boccaccini, A. R.; Bioactive Glass and Glass-Ceramic Scaffolds for Bone Tissue Engineering, Materials 2010, 3, 3867-3910.
CrossRef - Hoppe. A.; Jokic B.; Janackovic D.; Cobalt-Releasing 1393 Bioactive Glass-Derived Scaffolds for Bone Tissue Engineering Applications, ACS Appl. Mater. Interfaces 2014, 6, 2865−2877.
CrossRef - Ylanen, H. O.; “Bioactive glasses materials properties and applications”, Wood head Publishing Limited, Biomaterials, 2011, 6,. 1-288,.
- Heness, G.; Ben-Nissan, B. ; “Innovative bio-ceramics”, Mater Forum, 2004,. 27,. 104-114,.
- Watts, S. J.; O’Donnell, M. D.; Law, R. V.; Hill, R. G.; “Influence of magnesia on the structure and properties of bioactive glasses”, J. Non-Cryst. Solid, 2010, 356, 517-524.
- Brauer, D. S.; Karpukhina, N.; O’Donnell M. D.; Law, R. V.; Hill, R. G.; “Fluoride-containing bio-active glasses: Effect of glass design and structure on degradation pH and apatite formation in simulated body fluid”, Acta-Biomater., 2010.,. 6, . 3275-3282,
CrossRef - Fredholm,Y. C.; Karpukhina, N.; Law, R. V.; Hill, R. G.; “Strontium containing bioactive glasses glass structure and physical properties”, J. Non-Cryst. Solids, 2010, 356,. 2546-2551,.
CrossRef - Fatma, H.; ElBatal; Amany ;ElKheshen; Materials Chemistry and Physics, 2008,110 ,352-362.
- O’Donnell, M. D.; Candarlioglu, P. L.; Miller C. A.; Gentleman, E.; Stevens, M. M.; J. Mater. Chem., 2010, 20, 8934-8941.
CrossRef - Balamurugan, A.; Rebelo, A.H.; Lemos, A.F.; Rocha, J.H.; Ventura, J.M.; Ferreira, J.M.; Dent Mater.,2008,24,1374-1380
- CrossRef
- Oki, A.; Parveen, B.; Hossain, S; Adeniji, S.; Donahue, H.; J. Biomed Mater Res A. 2004; 69: 216-221.
CrossRef - Saboori, A.; Sheikhi, M.; Moztarzadeh, F.; Rabiee, M.; Hesaraki, S.; Tahriri, M.; AdvApll Ceram. 2009, 108,155-161.
CrossRef - Vikash Kumar Vyas; Arepalli Sampath Kumar; HimanshuTripathi; Singh, S.P.; Ram Pyare; Effect of Cr2O3 Addition on the Bioactivity and Physico-Mechanical Properties of 45S5 Bioactive Glass and Glass-Ceramic, International Journal of Engineering Research & Technology (IJERT) 2014, 3 2,1-15.
- Hulbert, S.F.; The use of alumina and zirconia in surgical implants.In: Hench, L.L.; Wilson J; editors. Advanced series in ceramics, vol. 1: An introduction to bioceramics. London: World Scientific; 1993.
CrossRef - Julian Jones, R.; New trends in bioactive scaffolds: The importance of nanostructure, Journal of the European ceramic society, 2009, 29(7), 1275-1281.
CrossRef - Miao, X.; Hu, Y.; Liu, J.; Huang, X.; “Hydroxyapatite coating on porous zirconia”, Materials Science and Engineering: 2007, 27[2],. 257-261.
CrossRef - Sarkar, R.; Banerjee, G.; Ceramic based biomedical implants. Inter. Ceramic, 2010, 2, 98–102.
- Zhang, S.; Hydroxyapatite Coatings for Biomedical Applications, Advances in Materials Science and Engineering, C.RC Press, 2013, 9,. 469.
- Ducheyne, P.; Hench, L.L.; Kagan, I.; Martens, A.; Bursens, A.; Mulier, J.C.; Effect of hydroxyapatite impregnations on skeletal bonding of porous coated implants. J. Biomed. Mater. Res.,1980, 14, 225–237.
CrossRef - Vyas.V.K. Kumar S.A.; Prasad S.;, Singh S.P.; Pyare R.; “Bioactivity and mechanical behavior of cobalt oxide-doped bioactive glass”, Bull. Mater. Sci.,. Indian Academy of Sciences 2015, 38,( 4),. 957–964.
CrossRef - Vyas.V.K. Kumar S.A.; Prasad S.; Mohammad E.;, Singh S.P.; Pyare R.; “Preparation and Characterization of Cobalt Oxide Doped 45S5 Bioactive Glass-Ceramics”, Innovations in Corrosion and Materials Science, 2015,5, 86-92,.
CrossRef - Vyas.V.K. Kumar S.A.; Singh S.P.; Pyare R.; “Effect of Cobalt Oxide Substitution on Mechanica Behaviour and Elastic Properties of Bioactive Glass and Glass-Ceramics,” Trans. Ind. Ceram. Soc., 2016, 75, 1,. 1-8 .
- Vyas.V.K. Kumar S.A.; Singh S.P.; Pyare R.; “Effect of nickel oxide substitution on bioactivity and mechanical properties of bioactive glass,” Bull. Mater. Sci., September 2016,. 39, 5. 1355–1361.
- Vyas.V.K.; Kumar S.A.; Singh S.P.; Pyare R.; Ali A.; Prasad S.; Md. Ershad; Srivastava P.; Mallick S.P., “Assessment of nickel oxide substituted bioactive glass-ceramic on in vitro bioactivity and mechanical properties,” Boletín de la Sociedad Española de Cerámica y Vidrio, 2016,69,.12 .
- Vyas.V.K. Kumar S.A.; Singh S.P.; Pyare R, “Destructive and non-destructive behavior of nickel oxide doped bioactive glass and glass-ceramic”, J Aust Ceram Soc, 2017, DOI 10.1007/s41779-017-0110-2.
- Tripathi H.; Kumar A. S.; Singh S. P.; “Preparation and characterization of Li2O–CaO–Al2O3–P2O5–SiO2 glasses as bioactive material,” Bull. Mater. Sci., 2016,. 39,. 2, ,. 365–376..
- Kokubo, T.; Takadama, H.; “How useful is SBF in predicting in vivo bone bioactivity”, Biomaterials,2006, 27.. 2907-2915.
CrossRef - Hench, L.L.; Journal of American Ceramic Society, 1998, 81, 1705–1728.
CrossRef - Koutsopoulos, S; Synthesis and characterization of hydrox- yapatite crystals: A review study on the analytical methods, J. Biomed. Mater.Res. 2002, 62 (4), 600−612.
CrossRef - Montagne, L.; Palavit G.; Mairesse G.; Phys.Chem.Glasses, 1996, 37(5),.206.
- Brow, R.K.; Tallant, D.R.; Myers, S.T.; Phifer C.C.; J. Non-Cryst. Solids, 1995, 45,.191.
- Corbridge, D.E.; J. Appl. Chem., 1956, 6,45
- arrigou-Lagrange, C.; Ouchetto M.; Elouadi, B.; Can. J. Chem. 1985, (63) ,1436.
- Gabelica-Robert, M.; Tarte, P.; J. Mol. Struct. ,1982, (79) ,251.
CrossRef - Salim, M.A.; Khattak, G.D.; Sakhawat Hussain, M.; J. Non-Cryst. 1995,Sol-ids 185 , 101.
- Chahine, A.; Et-tabirou, M.; Pascal, J.L.; FTIR and Raman spectra of the Na2O– CuO– Bi2O3 – P2O5 glasses, Materials Letters, 2004, (58), 2776–2780.
CrossRef - Abel, E. W.; Sabherwal I. H.; Reactions of the silicon–phosphorus bond. Part I. Insertions in trimethylsilyldiphenylphosphine, J. Chem. Soc. A, 1968, 1105-1108.
CrossRef - Rehman, I.; Karsh, M.; Hench, L.L.; Bonfield, W.; Analysis of apatite layers on glass–ceramic particulate using FTIR and FT-Raman spectroscopy, J. Biomed. Mater. Res., 2000, 50 (2), 97–100.
CrossRef - Filgueiras, M.R.; LaTorre, G.; Hench, L.L.; Solution effects on the surface reactions of three bioactive glass compositions, J. Biomed. Mater. Res,. 1993, 27(12), 1485–1493.
CrossRef - Nayak, J. P.; Kumar, S.; J. Bera, “Sol-gel synthesis of bio-glass- ceramics using rice husk ash as a source for silica and its characterization”, J. Non-Cryst. Solids, 2010,. 356, 1447-1451.
CrossRef - Arepalli S. K.; Tripathi, H.; Vyas, V. K.; Jain, S.; Suman, S. K.; Ram Pyare; Singh, S.P.; “Influence of barium substitution on bioactivity, thermal and physico-mechanical properties of bioactive glass”, Material science and engineering C , 2015, 49, 549-559.
CrossRef - Jayakumar, S.; Ananthapadmanabhan, P.V.; Perumal, K.; Thiyagarajan, T.K.; Mishra, S.C.; Su L.T.; Tok, A.I.Y.; J Guo, “Characterization of nano-crystalline ZrO2 synthesized via reactive plasma processing”, Materials Science & Engineering B, 2011, 12,894-899.
CrossRef - Sarkar, D.; Mohapatra, D.; Ray, S.; Bhattacharyya S.; Adak, S.; Mitra, N.;”Synthesis and characterization of sol-gel derived ZrO2 doped Al2O3 nanopowder”, Ceramic international ,2007, 33(7),1275-1282
CrossRef - JCPDS Card no. 1994, 9-432,
- Kansal, I.; Goel A.; Tulyaganov, D.U.; Santos, L.F.; Ferreira, J.M.F.; Structure, surface reac-tivity and physico-chemical degradation of fluoride containing phospho-silicate glasses, J. Mater. Chem. , 2011, 21(22), 8074-8084.
CrossRef - ElBatal H.; Azooz, M.; Khalil, E.M.; Soltan Monem A.; Hamdy, Y.; Characterization of some bioglass-ceramics, Mater. Chem. Phys., 2003, 80 (3), 599-609.
CrossRef

This work is licensed under a Creative Commons Attribution 4.0 International License.
![]()
A New Edition of Web of Science
Journal Impact Factor
2022: 0.5
Five Year: 0.8
Journal is Indexed in

Cabells Whitelist
![]()


